class: center, middle, inverse, title-slide .title[ # Продвинутая графика ] .subtitle[ ## Визуализация и анализ географических данных на языке R ] .author[ ### Тимофей Самсонов ] .institute[ ### МГУ имени Ломоносова, Географический факультет ] .date[ ### 2024-10-08 ] --- ## Источники данных - __Евростат__ (https://ec.europa.eu/eurostat/web/main/home), - __NASA POWER__ (https://power.larc.nasa.gov/) - __USDA NRCS Soil Data Access__ (https://sdmdataaccess.nrcs.usda.gov/) ``` r library(tidyverse) library(eurostat) library(nasapower) library(soilDB) ``` > Пакет soilDB лучше устанавливать из консоли командой `install.packages('soilDB', dependencies = TRUE)`. Указание параметра `dependencies = TRUE` обеспечит установку других пакетов, от которых он зависит. --- ## Коды Евростата Например, [таблица по продуктам питания, напиткам и табаку](https://ec.europa.eu/eurostat/databrowser/view/tet00034/default/table?lang=en) имеет код __ext_lt_mainagri__: <img src="img/eurostat.png" width="907" /> --- ## Загрузка данных Евростата .code-small[ ``` r tables = c('ext_lt_mainagri', 'ext_lt_mainrawm', 'ext_lt_mainmine', 'ext_lt_mainchem','ext_lt_mainmanu', 'ext_lt_mainmach') countries = ISOcodes::ISO_3166_1$Alpha_2 trades = lapply(tables, function(X) { # прочтем несколько таблиц в список get_eurostat(X) |> filter(partner %in% countries) |> label_eurostat() }) |> bind_rows() |> select(-geo) |> # убираем столбец с территорией торговли, т.к. там только Евросоюз filter(str_detect(indic_et, 'Exports in|Imports in')) |> pivot_wider(names_from = indic_et, values_from = values) |> rename(export = `Exports in million of ECU/EURO`, # дадим им краткие названия import = `Imports in million of ECU/EURO`, time = TIME_PERIOD) |> mutate(partner = as.factor(partner)) trades # посмотрим, что получилось ## # A tibble: 26,952 × 6 ## freq sitc06 partner time export import ## <chr> <chr> <fct> <date> <dbl> <dbl> ## 1 Annual Food, drinks and tobacco Andorra 2002-01-01 168. 2 ## 2 Annual Food, drinks and tobacco Andorra 2003-01-01 166. 5 ## 3 Annual Food, drinks and tobacco Andorra 2004-01-01 173. 11.4 ## 4 Annual Food, drinks and tobacco Andorra 2005-01-01 197. 32.8 ## 5 Annual Food, drinks and tobacco Andorra 2006-01-01 196. 41.1 ## 6 Annual Food, drinks and tobacco Andorra 2007-01-01 178. 2.2 ## 7 Annual Food, drinks and tobacco Andorra 2008-01-01 182. 13.6 ## 8 Annual Food, drinks and tobacco Andorra 2009-01-01 167. 7.6 ## 9 Annual Food, drinks and tobacco Andorra 2010-01-01 173. 0.5 ## 10 Annual Food, drinks and tobacco Andorra 2011-01-01 232. 0.6 ## # ℹ 26,942 more rows ``` ] --- ## Загрузка данных NASA POWER ``` r daily_single_ag <- get_power( community = "ag", lonlat = c(60.59, 56.84), pars = c("RH2M", "T2M"), dates = c("1995-04-01", "1995-04-30"), temporal_api = "daily" ) as_tibble(daily_single_ag) # посмотрим, что получилось ## # A tibble: 30 × 9 ## LON LAT YEAR MM DD DOY YYYYMMDD RH2M T2M ## <dbl> <dbl> <dbl> <int> <int> <int> <date> <dbl> <dbl> ## 1 60.6 56.8 1995 4 1 91 1995-04-01 81.7 5.65 ## 2 60.6 56.8 1995 4 2 92 1995-04-02 81.9 7.78 ## 3 60.6 56.8 1995 4 3 93 1995-04-03 78 8.31 ## 4 60.6 56.8 1995 4 4 94 1995-04-04 81.2 7.71 ## 5 60.6 56.8 1995 4 5 95 1995-04-05 92.4 5.1 ## 6 60.6 56.8 1995 4 6 96 1995-04-06 90.2 6.31 ## 7 60.6 56.8 1995 4 7 97 1995-04-07 83.4 3.38 ## 8 60.6 56.8 1995 4 8 98 1995-04-08 79 2.46 ## 9 60.6 56.8 1995 4 9 99 1995-04-09 81.2 3.49 ## 10 60.6 56.8 1995 4 10 100 1995-04-10 76.9 4.4 ## # ℹ 20 more rows ``` --- ## Загрузка данных NASA POWER ``` r interannual_sse <- get_power( community = "ag", lonlat = c(60.59, 56.84), dates = 1995:2015, temporal_api = "climatology", pars = c("CLRSKY_SFC_SW_DWN", "ALLSKY_SFC_SW_DWN") ) as_tibble(interannual_sse) # посмотрим, что получилось ## # A tibble: 2 × 16 ## LON LAT PARAMETER JAN FEB MAR APR MAY JUN JUL AUG SEP ## <dbl> <dbl> <chr> <dbl> <dbl> <dbl> <dbl> <dbl> <dbl> <dbl> <dbl> <dbl> ## 1 60.6 56.8 ALLSKY_SFC_… 2.59 6.03 11.0 14.8 18.7 20.0 19.4 14.8 9.78 ## 2 60.6 56.8 CLRSKY_SFC_… 3.37 7.41 13.8 20.2 26.0 28.4 26.4 21.2 15 ## # ℹ 4 more variables: OCT <dbl>, NOV <dbl>, DEC <dbl>, ANN <dbl> ``` --- ## Загрузка данных Soil Data Access Результирющий объект представляет собой список со множеством таблиц, которые характеризуют как почвенную серию в целом, так и отдельные ее разрезы: ``` r soils = c('wilkes', 'chewacla', 'congaree') series = fetchOSD(soils, extended = TRUE) str(series) ## List of 18 ## $ SPC :Formal class 'SoilProfileCollection' [package "aqp"] with 9 slots ## .. ..@ idcol : chr "id" ## .. ..@ hzidcol : chr "hzID" ## .. ..@ depthcols : chr [1:2] "top" "bottom" ## .. ..@ metadata :List of 8 ## .. .. ..$ aqp_df_class : chr "data.frame" ## .. .. ..$ aqp_group_by : chr "" ## .. .. ..$ aqp_hzdesgn : chr "hzname" ## .. .. ..$ aqp_hztexcl : chr "texture_class" ## .. .. ..$ depth_units : chr "cm" ## .. .. ..$ stringsAsFactors: logi FALSE ## .. .. ..$ origin : chr "OSD via Soilweb / fetchOSD" ## .. .. ..$ created : POSIXct[1:1], format: "2024-10-08 11:52:33" ## .. ..@ horizons :'data.frame': 22 obs. of 22 variables: ## .. .. ..$ id : chr [1:22] "CHEWACLA" "CHEWACLA" "CHEWACLA" "CHEWACLA" ... ## .. .. ..$ top : int [1:22] 0 10 36 66 97 119 152 0 20 46 ... ## .. .. ..$ bottom : int [1:22] 10 36 66 97 119 152 203 20 46 56 ... ## .. .. ..$ hzname : chr [1:22] "Ap" "Bw1" "Bw2" "Bw3" ... ## .. .. ..$ soil_color : chr [1:22] "#7D593AFF" "#795B36FF" "#795B36FF" "#7D593AFF" ... ## .. .. ..$ hue : chr [1:22] "7.5YR" "10YR" "10YR" "7.5YR" ... ## .. .. ..$ value : int [1:22] 4 4 4 4 5 5 4 4 4 3 ... ## .. .. ..$ chroma : int [1:22] 4 4 4 4 8 1 4 4 3 3 ... ## .. .. ..$ dry_hue : chr [1:22] "7.5YR" "10YR" "10YR" "7.5YR" ... ## .. .. ..$ dry_value : int [1:22] 6 6 6 6 6 6 6 6 6 5 ... ## .. .. ..$ dry_chroma : int [1:22] 4 4 4 4 7 1 4 4 3 3 ... ## .. .. ..$ texture_class : Ord.factor w/ 21 levels "coarse sand"<..: 13 18 17 13 17 17 13 13 13 NA ... ## .. .. ..$ cf_class : logi [1:22] NA NA NA NA NA NA ... ## .. .. ..$ pH : logi [1:22] NA NA NA NA NA NA ... ## .. .. ..$ pH_class : Ord.factor w/ 12 levels "ultra acid"<"extremely acid"<..: 3 3 3 3 3 3 3 4 NA NA ... ## .. .. ..$ distinctness : chr [1:22] "clear" "gradual" "gradual" "gradual" ... ## .. .. ..$ topography : chr [1:22] "smooth" "wavy" "wavy" "wavy" ... ## .. .. ..$ dry_color_estimated : logi [1:22] TRUE TRUE TRUE TRUE TRUE TRUE ... ## .. .. ..$ moist_color_estimated: logi [1:22] FALSE FALSE FALSE FALSE FALSE FALSE ... ## .. .. ..$ narrative : chr [1:22] "Ap--0 to 4 inches; brown (7.5YR 4/4) loam; weak medium granular structure; friable; common very fine, fine, and"| __truncated__ "Bw1--4 to 14 inches; dark yellowish brown (10YR 4/4) silty clay loam; weak medium subangular blocky structure; "| __truncated__ "Bw2--14 to 26 inches; dark yellowish brown (10YR 4/4) clay loam; weak medium subangular blocky structure; friab"| __truncated__ "Bw3--26 to 38 inches; brown (7.5YR 4/4) loam; weak medium subangular blocky structure; friable; common fine roo"| __truncated__ ... ## .. .. ..$ hzID : chr [1:22] "1" "2" "3" "4" ... ## .. .. ..$ hzd : num [1:22] 2.5 7.5 7.5 7.5 7.5 7.5 0 2.5 7.5 2.5 ... ## .. ..@ site :'data.frame': 3 obs. of 31 variables: ## .. .. ..$ id : chr [1:3] "CHEWACLA" "CONGAREE" "WILKES" ## .. .. ..$ soilseriesiid : int [1:3] 24628 1057 23800 ## .. .. ..$ series_status : chr [1:3] "established" "established" "established" ## .. .. ..$ benchmarksoilflag : chr [1:3] "TRUE" "FALSE" "FALSE" ## .. .. ..$ soiltaxclasslastupdated: chr [1:3] "2010-02-11 00:00:00" "2002-07-18 00:00:00" "1997-06-06 00:00:00" ## .. .. ..$ mlraoffice : chr [1:3] "raleigh, nc" "raleigh, nc" "raleigh, nc" ## .. .. ..$ family : chr [1:3] "fine-loamy, mixed, active, thermic fluvaquentic dystrudepts" "fine-loamy, mixed, active, nonacid, thermic oxyaquic udifluvents" "loamy, mixed, active, thermic, shallow typic hapludalfs" ## .. .. ..$ soilorder : chr [1:3] "inceptisols" "entisols" "alfisols" ## .. .. ..$ suborder : chr [1:3] "udepts" "fluvents" "udalfs" ## .. .. ..$ greatgroup : chr [1:3] "dystrudepts" "udifluvents" "hapludalfs" ## .. .. ..$ subgroup : chr [1:3] "fluvaquentic dystrudepts" "oxyaquic udifluvents" "typic hapludalfs" ## .. .. ..$ tax_partsize : chr [1:3] "fine-loamy" "fine-loamy" "loamy" ## .. .. ..$ tax_partsizemod : logi [1:3] NA NA NA ## .. .. ..$ tax_ceactcl : chr [1:3] "active" "active" "active" ## .. .. ..$ tax_reaction : chr [1:3] NA "nonacid" NA ## .. .. ..$ tax_tempcl : chr [1:3] "thermic" "thermic" "thermic" ## .. .. ..$ tax_minclass : chr [1:3] "mixed" "mixed" "mixed" ## .. .. ..$ taxfamhahatmatcl : logi [1:3] NA NA NA ## .. .. ..$ originyear : logi [1:3] NA NA NA ## .. .. ..$ establishedyear : int [1:3] 1937 1904 1916 ## .. .. ..$ descriptiondateinitial : chr [1:3] "2010-02-11 00:00:00+00" "2002-07-18 00:00:00+00" "2007-09-06 00:00:00+00" ## .. .. ..$ descriptiondateupdated : chr [1:3] "2010-02-11 00:00:00+00" "2002-07-18 00:00:00+00" "2021-01-27 16:02:50.637+00" ## .. .. ..$ statsgoflag : chr [1:3] "TRUE" "TRUE" "TRUE" ## .. .. ..$ areasymbol : chr [1:3] "NC" "SC" "NC" ## .. .. ..$ areaname : chr [1:3] "North Carolina" "South Carolina" "North Carolina" ## .. .. ..$ areatypename : chr [1:3] "State or Territory" "State or Territory" "State or Territory" ## .. .. ..$ subgroup_mod : chr [1:3] "fluvaquentic" "oxyaquic" "typic" ## .. .. ..$ greatgroup_mod : chr [1:3] "dystr" "udi" "hapl" ## .. .. ..$ drainagecl : chr [1:3] "somewhat poorly" "well to moderately well" "well" ## .. .. ..$ ac : int [1:3] 1254622 215993 614348 ## .. .. ..$ n_polygons : int [1:3] 38657 10260 34850 ## .. ..@ sp :Formal class 'SpatialPoints' [package "sp"] with 3 slots ## .. .. .. ..@ coords : num [1, 1] 0 ## .. .. .. ..@ bbox : logi [1, 1] NA ## .. .. .. ..@ proj4string:Formal class 'CRS' [package "sp"] with 1 slot ## .. .. .. .. .. ..@ projargs: chr NA ## .. ..@ diagnostic :'data.frame': 0 obs. of 0 variables ## .. ..@ restrictions:'data.frame': 0 obs. of 0 variables ## $ competing :'data.frame': 1 obs. of 3 variables: ## ..$ series : chr "CHEWACLA" ## ..$ competing: chr "OAKBORO" ## ..$ family : chr "fine-loamy, mixed, active, thermic fluvaquentic dystrudepts" ## $ geog_assoc_soils:'data.frame': 45 obs. of 2 variables: ## ..$ series: chr [1:45] "CHEWACLA" "CHEWACLA" "CHEWACLA" "CHEWACLA" ... ## ..$ gas : chr [1:45] "ALTAVISTA" "AUGUSTA" "BIBB" "BUNCOMBE" ... ## $ geomcomp :'data.frame': 2 obs. of 9 variables: ## ..$ series : chr [1:2] "CHEWACLA" "WILKES" ## ..$ Interfluve : num [1:2] 1 0.178 ## ..$ Crest : num [1:2] 0 0.027 ## ..$ Head Slope : int [1:2] 0 0 ## ..$ Nose Slope : int [1:2] 0 0 ## ..$ Side Slope : num [1:2] 0 0.795 ## ..$ Base Slope : int [1:2] 0 0 ## ..$ n : int [1:2] 3 185 ## ..$ shannon_entropy: num [1:2] 0 0.848 ## $ hillpos :'data.frame': 3 obs. of 8 variables: ## ..$ series : chr [1:3] "CHEWACLA" "CONGAREE" "WILKES" ## ..$ Toeslope : num [1:3] 1 0.846 0 ## ..$ Footslope : num [1:3] 0 0.154 0 ## ..$ Backslope : num [1:3] 0 0 0.637 ## ..$ Shoulder : num [1:3] 0 0 0.225 ## ..$ Summit : num [1:3] 0 0 0.139 ## ..$ n : int [1:3] 75 13 245 ## ..$ shannon_entropy: num [1:3] 0 0.619 1.294 ## $ mtnpos : logi FALSE ## $ terrace :'data.frame': 2 obs. of 5 variables: ## ..$ series : chr [1:2] "CHEWACLA" "CONGAREE" ## ..$ Tread : num [1:2] 0.977 1 ## ..$ Riser : num [1:2] 0.0233 0 ## ..$ n : int [1:2] 86 35 ## ..$ shannon_entropy: num [1:2] 0.16 0 ## $ flats :'data.frame': 2 obs. of 7 variables: ## ..$ series : chr [1:2] "CHEWACLA" "CONGAREE" ## ..$ Dip : num [1:2] 0.1455 0.0667 ## ..$ Talf : num [1:2] 0.855 0.867 ## ..$ Flat : int [1:2] 0 0 ## ..$ Rise : num [1:2] 0 0.0667 ## ..$ n : int [1:2] 55 15 ## ..$ shannon_entropy: num [1:2] 0.598 0.7 ## $ shape_across :'data.frame': 3 obs. of 8 variables: ## ..$ series : chr [1:3] "CHEWACLA" "CONGAREE" "WILKES" ## ..$ Concave : num [1:3] 0.0364 0.0213 0 ## ..$ Linear : num [1:3] 0.953 0.957 0.359 ## ..$ Convex : num [1:3] 0.0109 0.0213 0.641 ## ..$ Complex : int [1:3] 0 0 0 ## ..$ Undulating : int [1:3] 0 0 0 ## ..$ n : int [1:3] 275 94 195 ## ..$ shannon_entropy: num [1:3] 0.312 0.297 0.942 ## $ shape_down :'data.frame': 3 obs. of 8 variables: ## ..$ series : chr [1:3] "CHEWACLA" "CONGAREE" "WILKES" ## ..$ Concave : num [1:3] 0.3309 0.0217 0 ## ..$ Linear : num [1:3] 0.658 0.946 0.636 ## ..$ Convex : num [1:3] 0.0109 0.0326 0.3641 ## ..$ Complex : int [1:3] 0 0 0 ## ..$ Undulating : int [1:3] 0 0 0 ## ..$ n : int [1:3] 275 92 195 ## ..$ shannon_entropy: num [1:3] 0.996 0.357 0.946 ## $ pmkind :'data.frame': 6 obs. of 5 variables: ## ..$ series: chr [1:6] "CHEWACLA" "CHEWACLA" "CONGAREE" "CONGAREE" ... ## ..$ pmkind: chr [1:6] "Alluvium" "Residuum" "Alluvium" "Fluviomarine deposits" ... ## ..$ n : int [1:6] 205 1 72 13 1 262 ## ..$ total : int [1:6] 206 206 86 86 86 262 ## ..$ P : num [1:6] 0.9951 0.0049 0.8372 0.1512 0.0116 ... ## $ pmorigin :'data.frame': 24 obs. of 5 variables: ## ..$ series : chr [1:24] "CHEWACLA" "CHEWACLA" "CHEWACLA" "CHEWACLA" ... ## ..$ pmorigin: chr [1:24] "Igneous and metamorphic rock" "Sedimentary rock" "Granite and gneiss" "Mixed" ... ## ..$ n : int [1:24] 29 11 2 2 1 1 1 1 1 1 ... ## ..$ total : int [1:24] 51 51 51 51 51 51 51 51 51 51 ... ## ..$ P : num [1:24] 0.5686 0.2157 0.0392 0.0392 0.0196 ... ## $ mlra :'data.frame': 21 obs. of 4 variables: ## ..$ series : chr [1:21] "CHEWACLA" "CHEWACLA" "CHEWACLA" "CHEWACLA" ... ## ..$ mlra : chr [1:21] "148" "135A" "136" "133A" ... ## ..$ area_ac : int [1:21] 7911 4245 920965 105979 85493 55614 30799 19434 14232 9855 ... ## ..$ membership: num [1:21] 0.006 0.003 0.734 0.084 0.068 0.044 0.025 0.015 0.011 0.008 ... ## $ ecoclassid :'data.frame': 18 obs. of 5 variables: ## ..$ series : chr [1:18] "CHEWACLA" "CHEWACLA" "CHEWACLA" "CHEWACLA" ... ## ..$ ecoclassid : chr [1:18] "F133CA999AL" "F136XY100VA" "F136XY610GA" "F133AY003NC" ... ## ..$ n_components: int [1:18] 2 2 139 4 3 4 5 6 1 4 ... ## ..$ area_ac : int [1:18] 6589 5976 936606 43345 37459 29783 24850 19003 13987 8008 ... ## ..$ proportion : num [1:18] 0.0059 0.0053 0.8319 0.0385 0.0333 ... ## $ climate.annual :'data.frame': 24 obs. of 12 variables: ## ..$ series : chr [1:24] "CHEWACLA" "CHEWACLA" "CHEWACLA" "CHEWACLA" ... ## ..$ climate_var: chr [1:24] "Elevation (m)" "Effective Precipitation (mm)" "Frost-Free Days" "Mean Annual Air Temperature (degrees C)" ... ## ..$ minimum : num [1:24] 0 128.8 177 12.1 986 ... ## ..$ q01 : num [1:24] 7 216 188 13 1069 ... ## ..$ q05 : num [1:24] 33 245.9 196 13.5 1094 ... ## ..$ q25 : num [1:24] 125 310.2 208 14.9 1136 ... ## ..$ q50 : num [1:24] 191 348.8 218 15.7 1175 ... ## ..$ q75 : num [1:24] 247 442.9 227 16.4 1277 ... ## ..$ q95 : num [1:24] 347 569.2 235 17.3 1394 ... ## ..$ q99 : num [1:24] 479 740.4 244 17.8 1575.1 ... ## ..$ maximum : num [1:24] 919 1382.8 300 19.7 2202 ... ## ..$ n : int [1:24] 29784 29784 29784 29784 29784 29784 29784 29784 7547 7547 ... ## $ climate.monthly :'data.frame': 72 obs. of 14 variables: ## ..$ series : chr [1:72] "CHEWACLA" "CHEWACLA" "CHEWACLA" "CHEWACLA" ... ## ..$ climate_var: chr [1:72] "ppt1" "ppt2" "ppt3" "ppt4" ... ## ..$ minimum : num [1:72] 61 64 81 63 60 78 83 74 68 53 ... ## ..$ q01 : num [1:72] 75 71 93 71 69 83 92 85 81 72 ... ## ..$ q05 : num [1:72] 83 73 99 75 72 ... ## ..$ q25 : num [1:72] 93 83 105 82 81 96 108 96 91 82 ... ## ..$ q50 : num [1:72] 105 106 119 88 92 101 115 102 98 86 ... ## ..$ q75 : num [1:72] 116 121 128 95 101 106 123 110 105 91 ... ## ..$ q95 : num [1:72] 131 135 137 111 112 117 133 129 118 100 ... ## ..$ q99 : num [1:72] 150 144 147 122 125 133 143 142 137 109 ... ## ..$ maximum : num [1:72] 248 227 239 150 167 198 220 207 192 158 ... ## ..$ n : int [1:72] 29784 29784 29784 29784 29784 29784 29784 29784 29784 29784 ... ## ..$ month : Factor w/ 12 levels "1","2","3","4",..: 1 2 3 4 5 6 7 8 9 10 ... ## ..$ variable : Factor w/ 2 levels "Potential ET (mm)",..: 2 2 2 2 2 2 2 2 2 2 ... ## $ NCCPI :'data.frame': 3 obs. of 16 variables: ## ..$ series : chr [1:3] "CHEWACLA" "CONGAREE" "WILKES" ## ..$ n : int [1:3] 266 94 158 ## ..$ nccpi_irrigated_q01: num [1:3] 0.188 0.816 0.268 ## ..$ nccpi_irrigated_q05: num [1:3] 0.346 0.825 0.269 ## ..$ nccpi_irrigated_q25: num [1:3] 0.564 0.861 0.32 ## ..$ nccpi_irrigated_q50: num [1:3] 0.597 0.907 0.361 ## ..$ nccpi_irrigated_q75: num [1:3] 0.654 0.925 0.419 ## ..$ nccpi_irrigated_q95: num [1:3] 0.849 0.979 0.561 ## ..$ nccpi_irrigated_q99: num [1:3] 0.93 0.984 0.614 ## ..$ nccpi_q01 : num [1:3] 0.347 0.5926 0.0426 ## ..$ nccpi_q05 : num [1:3] 0.56 0.651 0.0564 ## ..$ nccpi_q25 : num [1:3] 0.624 0.76 0.146 ## ..$ nccpi_q50 : num [1:3] 0.685 0.813 0.231 ## ..$ nccpi_q75 : num [1:3] 0.711 0.852 0.268 ## ..$ nccpi_q95 : num [1:3] 0.837 0.936 0.379 ## ..$ nccpi_q99 : num [1:3] 0.84 0.947 0.57 ## $ soilweb.metadata:'data.frame': 24 obs. of 2 variables: ## ..$ product : chr [1:24] "block diagram archive" "cached sketches" "component pedons" "ESID-series cross-tabulation" ... ## ..$ last_update: chr [1:24] "2019-12-17" "2023-10-12" "2023-10-09" "2023-11-06" ... ``` --- ## Быстрый график ggplot .pull-left[ Суммарный экспорт через `qplot()`: ``` r trades_total = trades |> group_by(time) |> summarise(export = sum(export), import = sum(import)) qplot(time, export, data = trades_total, geom = c('point', 'line')) ``` ] .pull-right[ 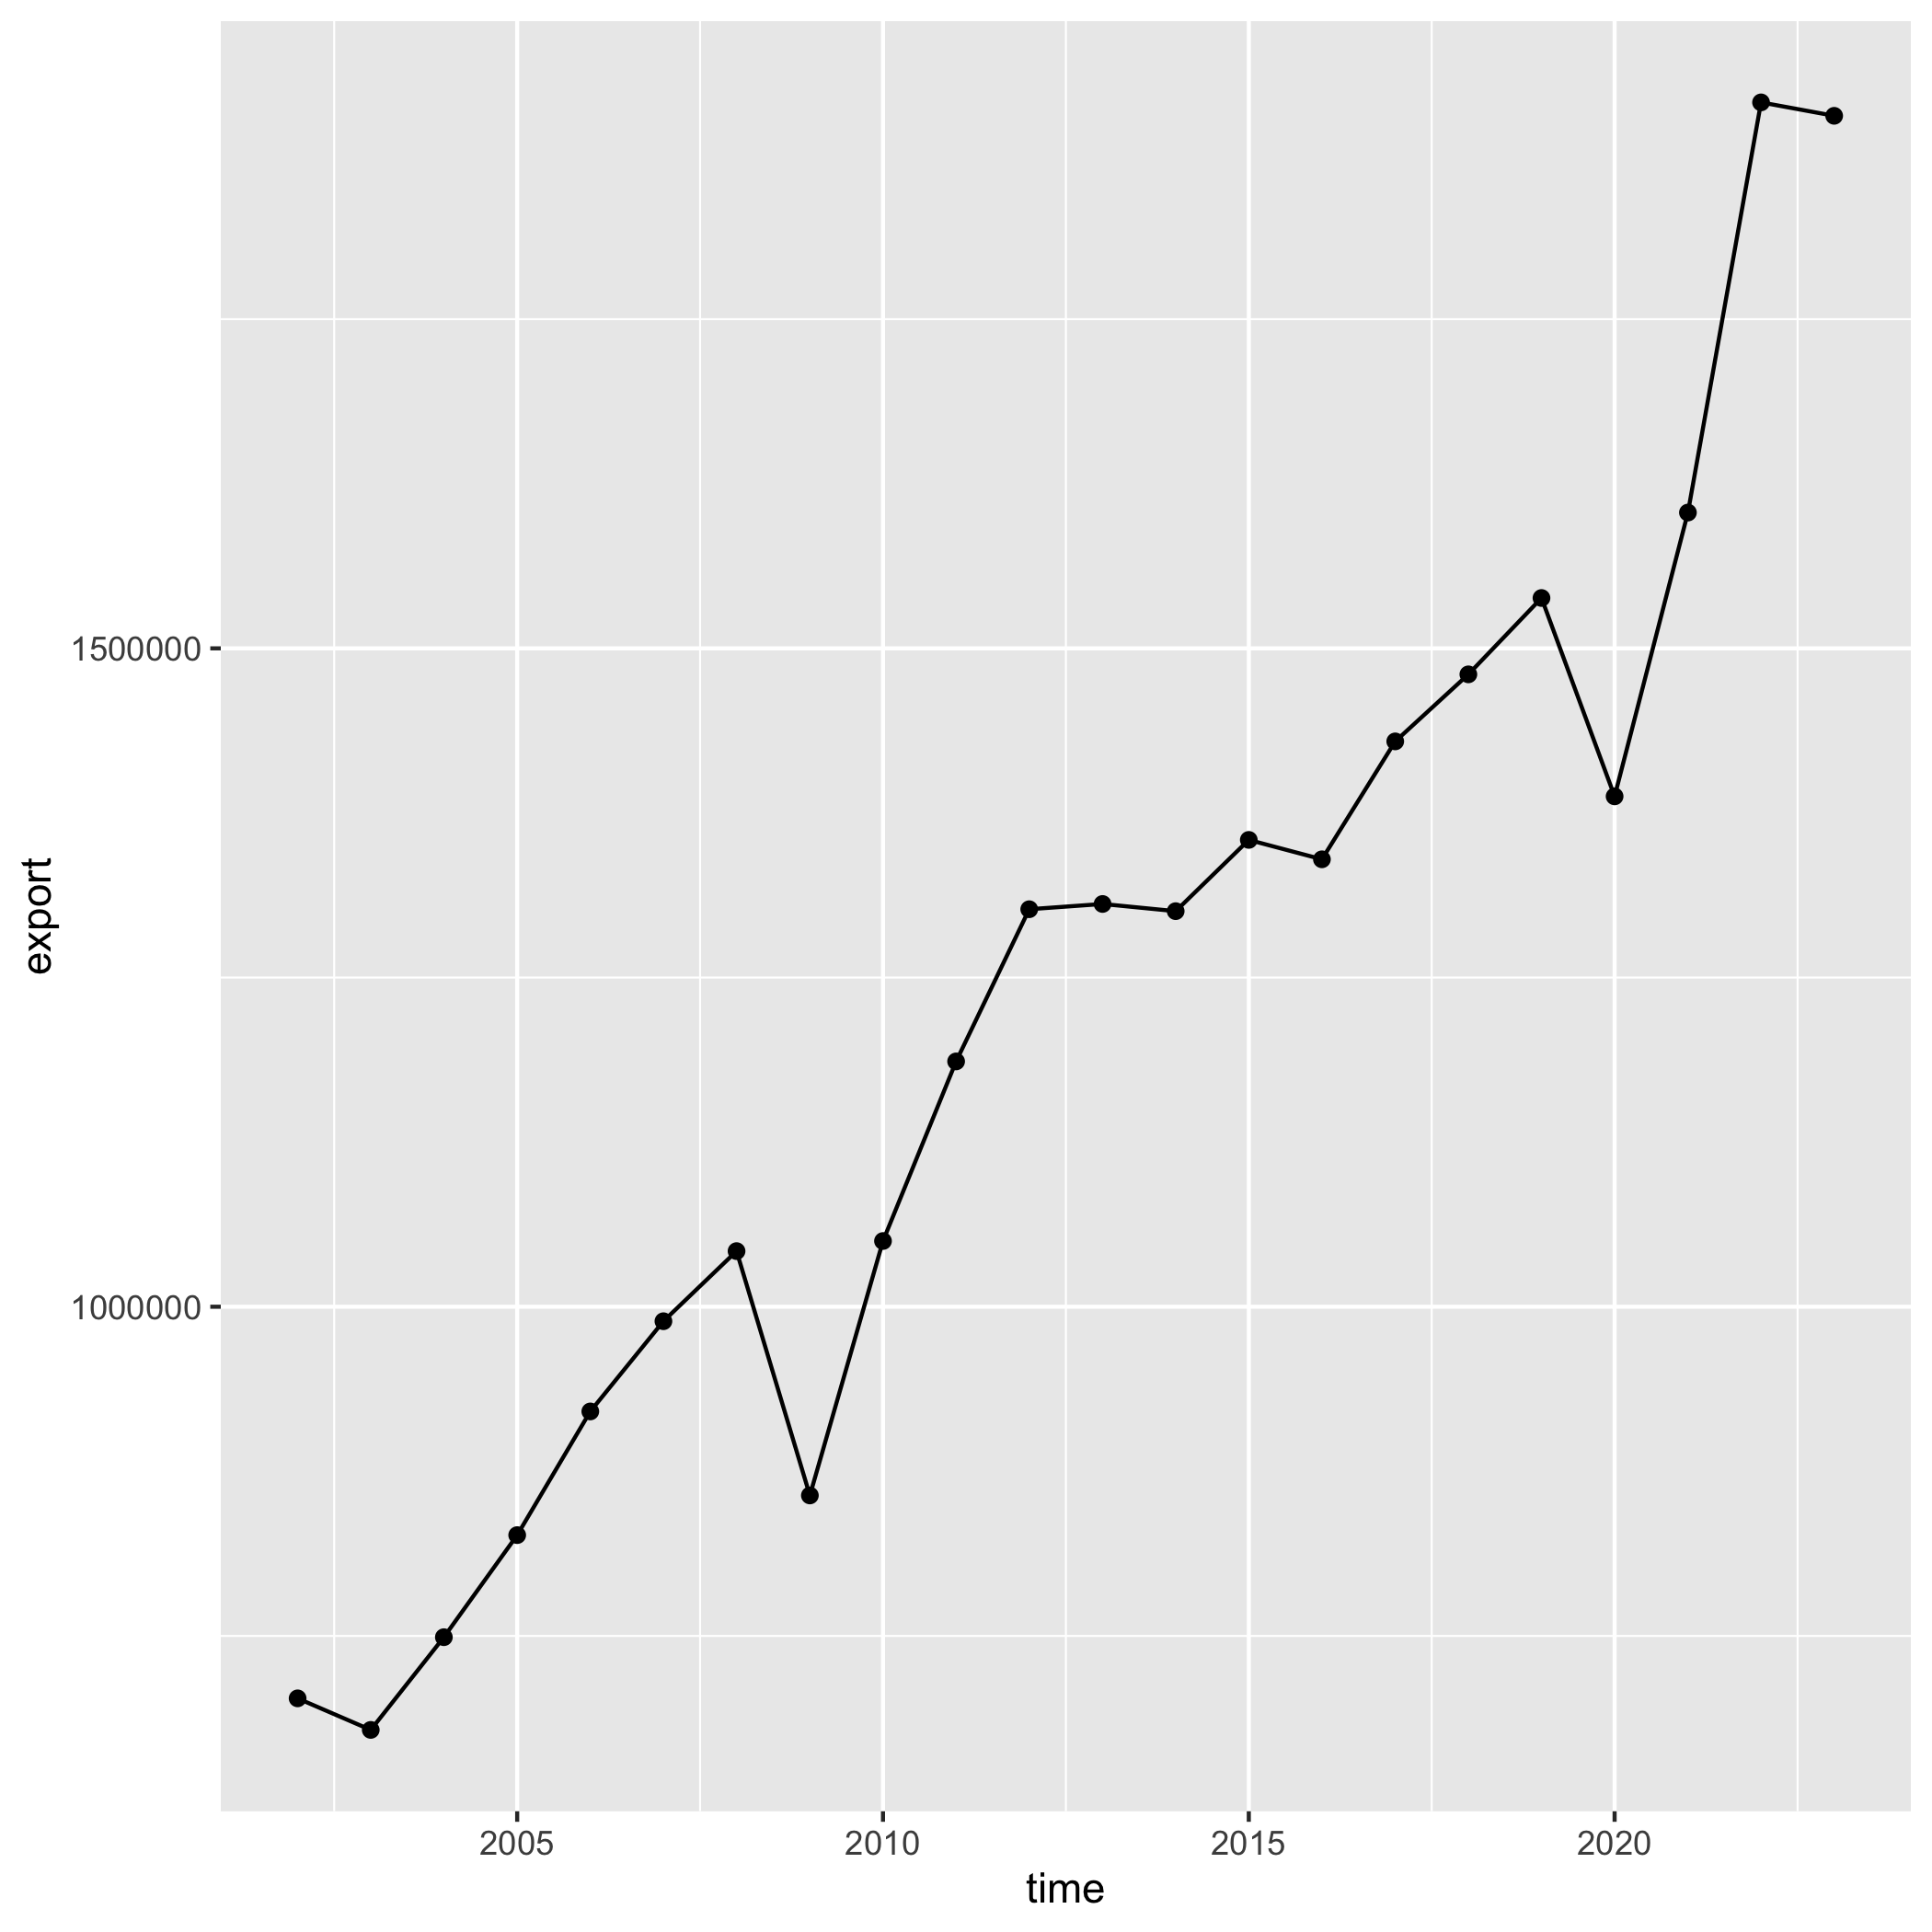<!-- --> ] --- ## Базовый шаблон ggplot Базовый шаблон __ggplot__: ``` r ggplot(data = <DATA>) + <GEOM_FUNCTION>(mapping = aes(<MAPPINGS>)) ``` где: - `DATA` — источник данных (фрейм, тиббл) - `GEOM_FUNCTION` — функция, отвечающая за геометрический тип графика (точки, линии, гистограммы и т.д.) - `MAPPINGS` — перечень соответствий между переменными данных (содержащихся в `DATA`) и графическими переменными (координатами, размерами, цветами и т.д.) --- ## Геометрические типы .pull-left[ Точки `geom_point()`: .code-small[ ``` r ggplot(data = trades_total) + geom_point(mapping = aes(x = time, y = export)) ``` <!-- --> ] ] .pull-right[ Линии `geom_line()`: .code-small[ ``` r ggplot(data = trades_total) + geom_line(mapping = aes(x = time, y = export)) ``` <!-- --> ] ] --- ## Геометрические типы .pull-left[ Ступенчатые кривые`geom_step()`: .code-small[ ``` r ggplot(data = trades_total) + geom_step(mapping = aes(x = time, y = export)) ``` <!-- --> ] ] .pull-right[ Совмещение геометрий: .code-small[ ``` r ggplot(data = trades_total) + geom_line(mapping = aes(x = time, y = export)) + geom_point(mapping = aes(x = time, y = export)) ``` <!-- --> ] ] --- ## Геометрические типы .pull-left[ Вынос общих данных: .code-small[ ``` r ggplot(data = trades_total, mapping = aes(x = time, y = export)) + geom_line() + geom_point() ``` <!-- --> ] ] .pull-right[ Заливка `geom_area()`: .code-small[ ``` r ggplot(data = trades_total, mapping = aes(x = time, y = export)) + geom_area(alpha = 0.5) + # полигон с прозрачностью 0,5 geom_line() + geom_point() ``` <!-- --> ] ] --- ## Геометрические типы ``` r df = trades |> filter(sitc06 == 'Machinery and transport equipment', time == as.Date('2022-01-01'), export > 10000) ``` .pull-left[ Столбчатая диаграмма: ``` r ggplot( df, mapping = aes( x = partner, y = export ) ) + geom_col() ``` ] .pull-right[ 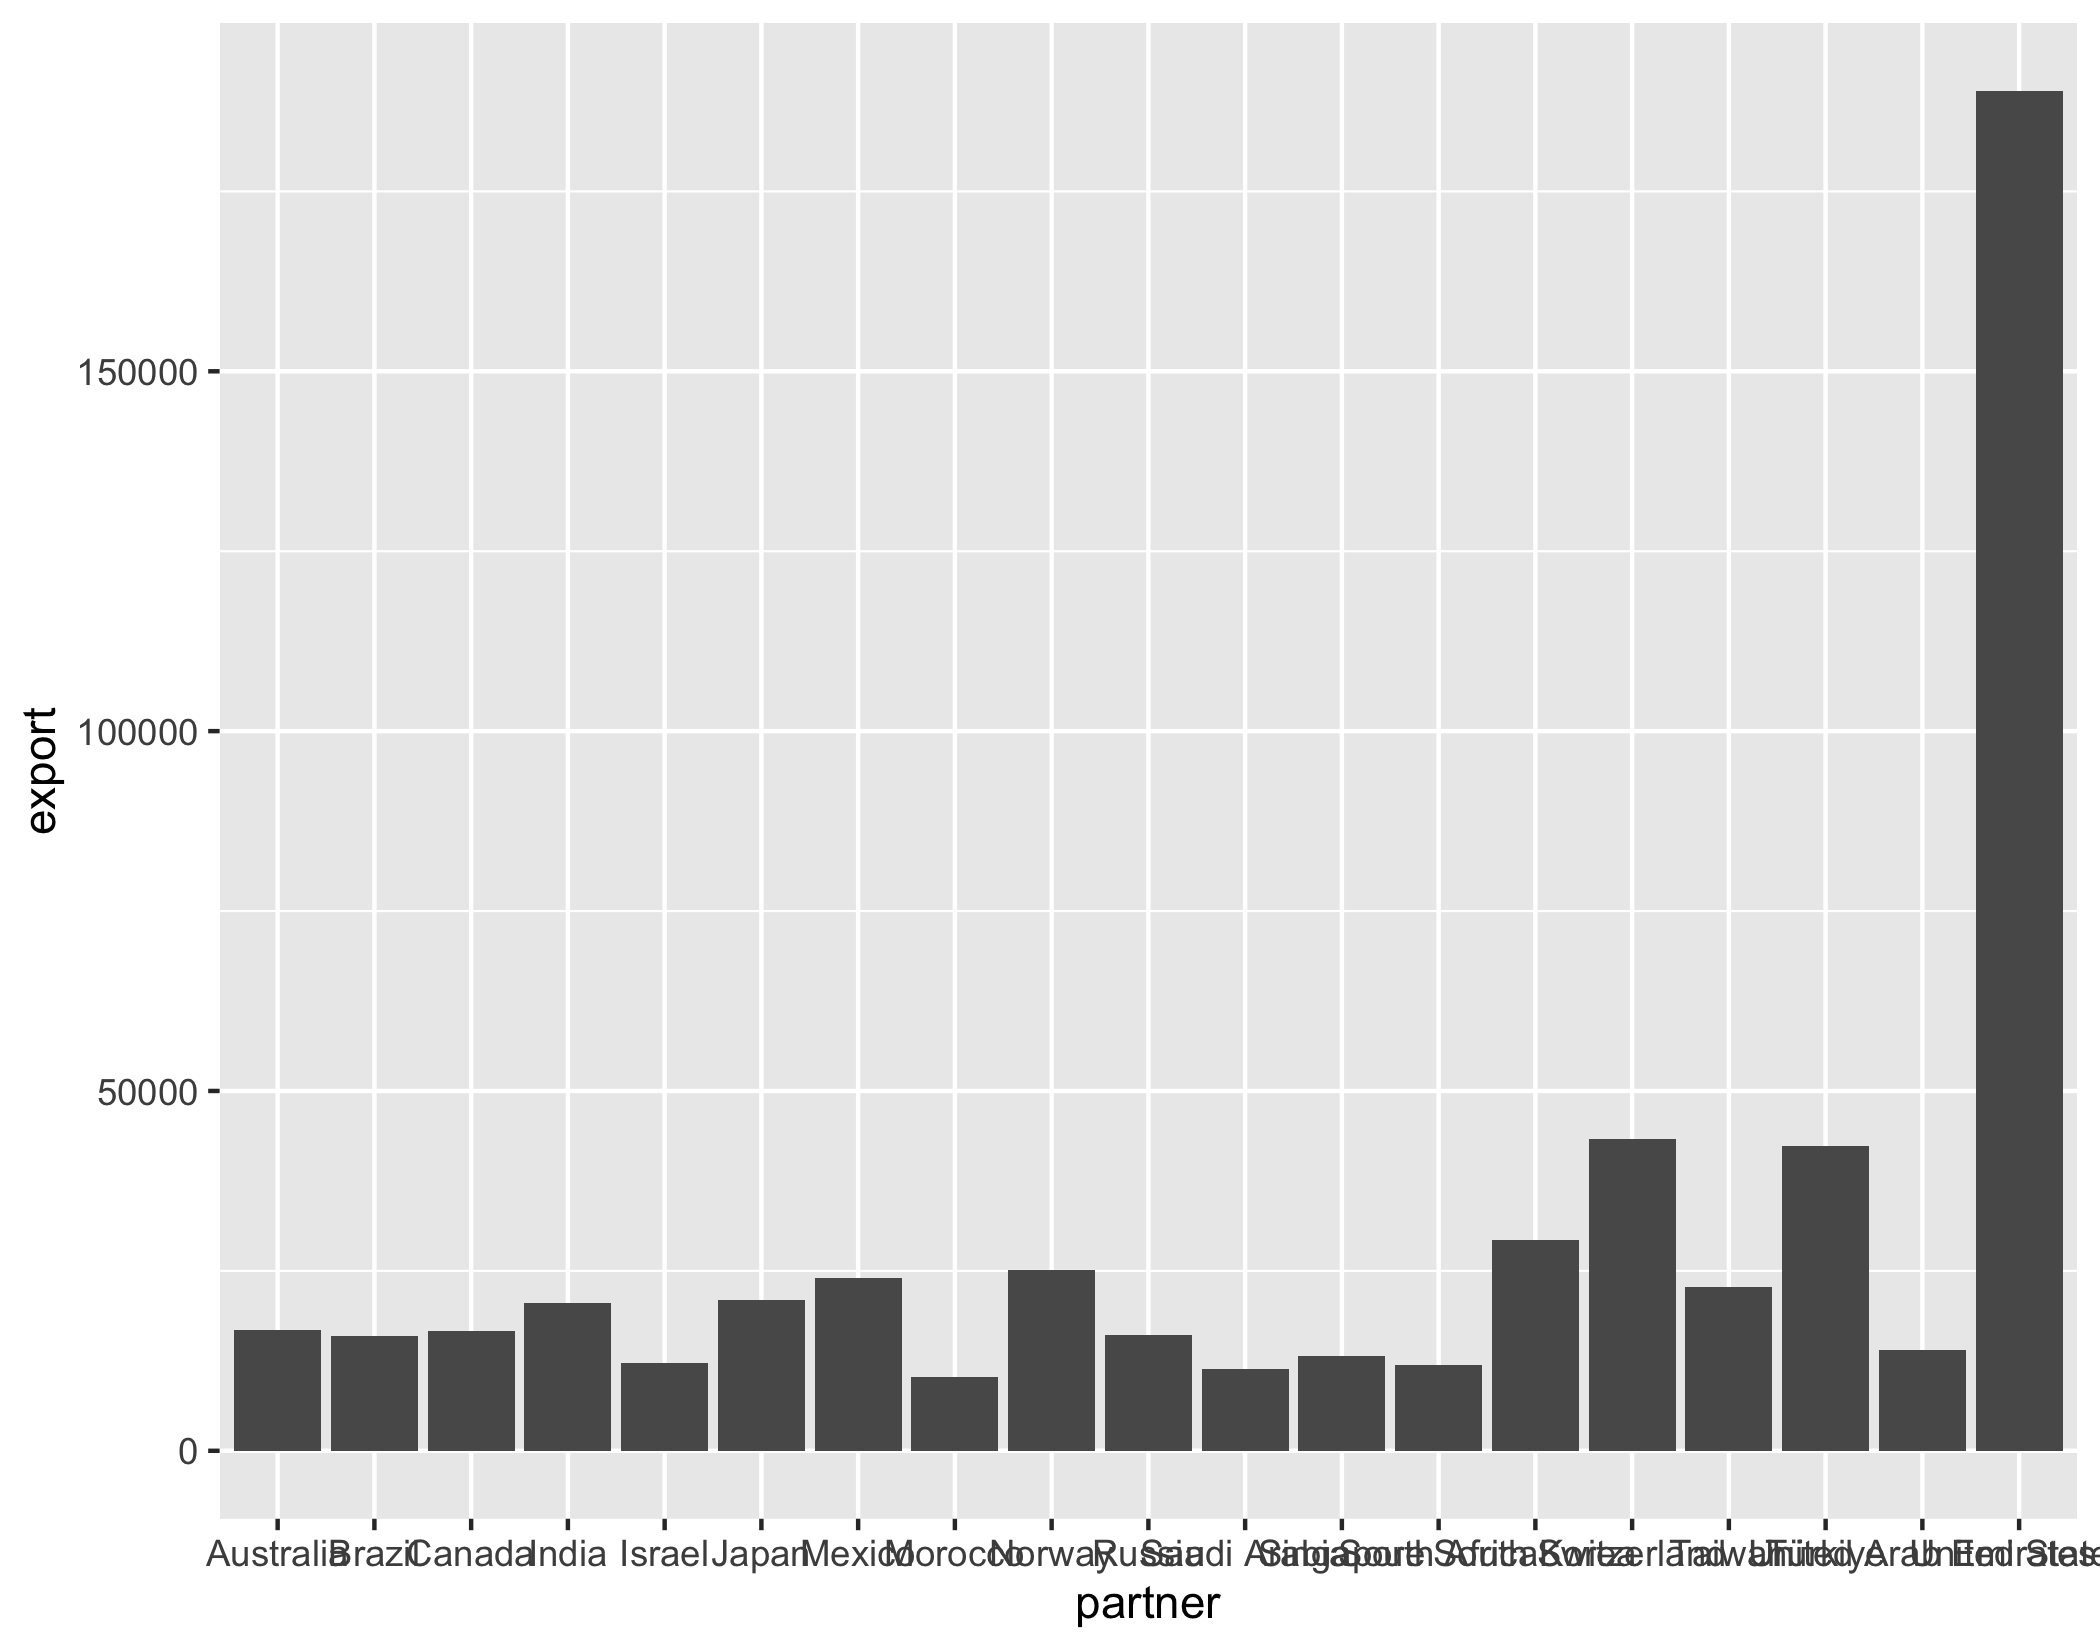<!-- --> ] --- ## Геометрические типы .pull-left[ Перестановка осей через `coord_flip()`: ``` r ggplot(df, mapping = aes(x = partner, y = export)) + geom_col() + coord_flip() ``` ] .pull-right[ 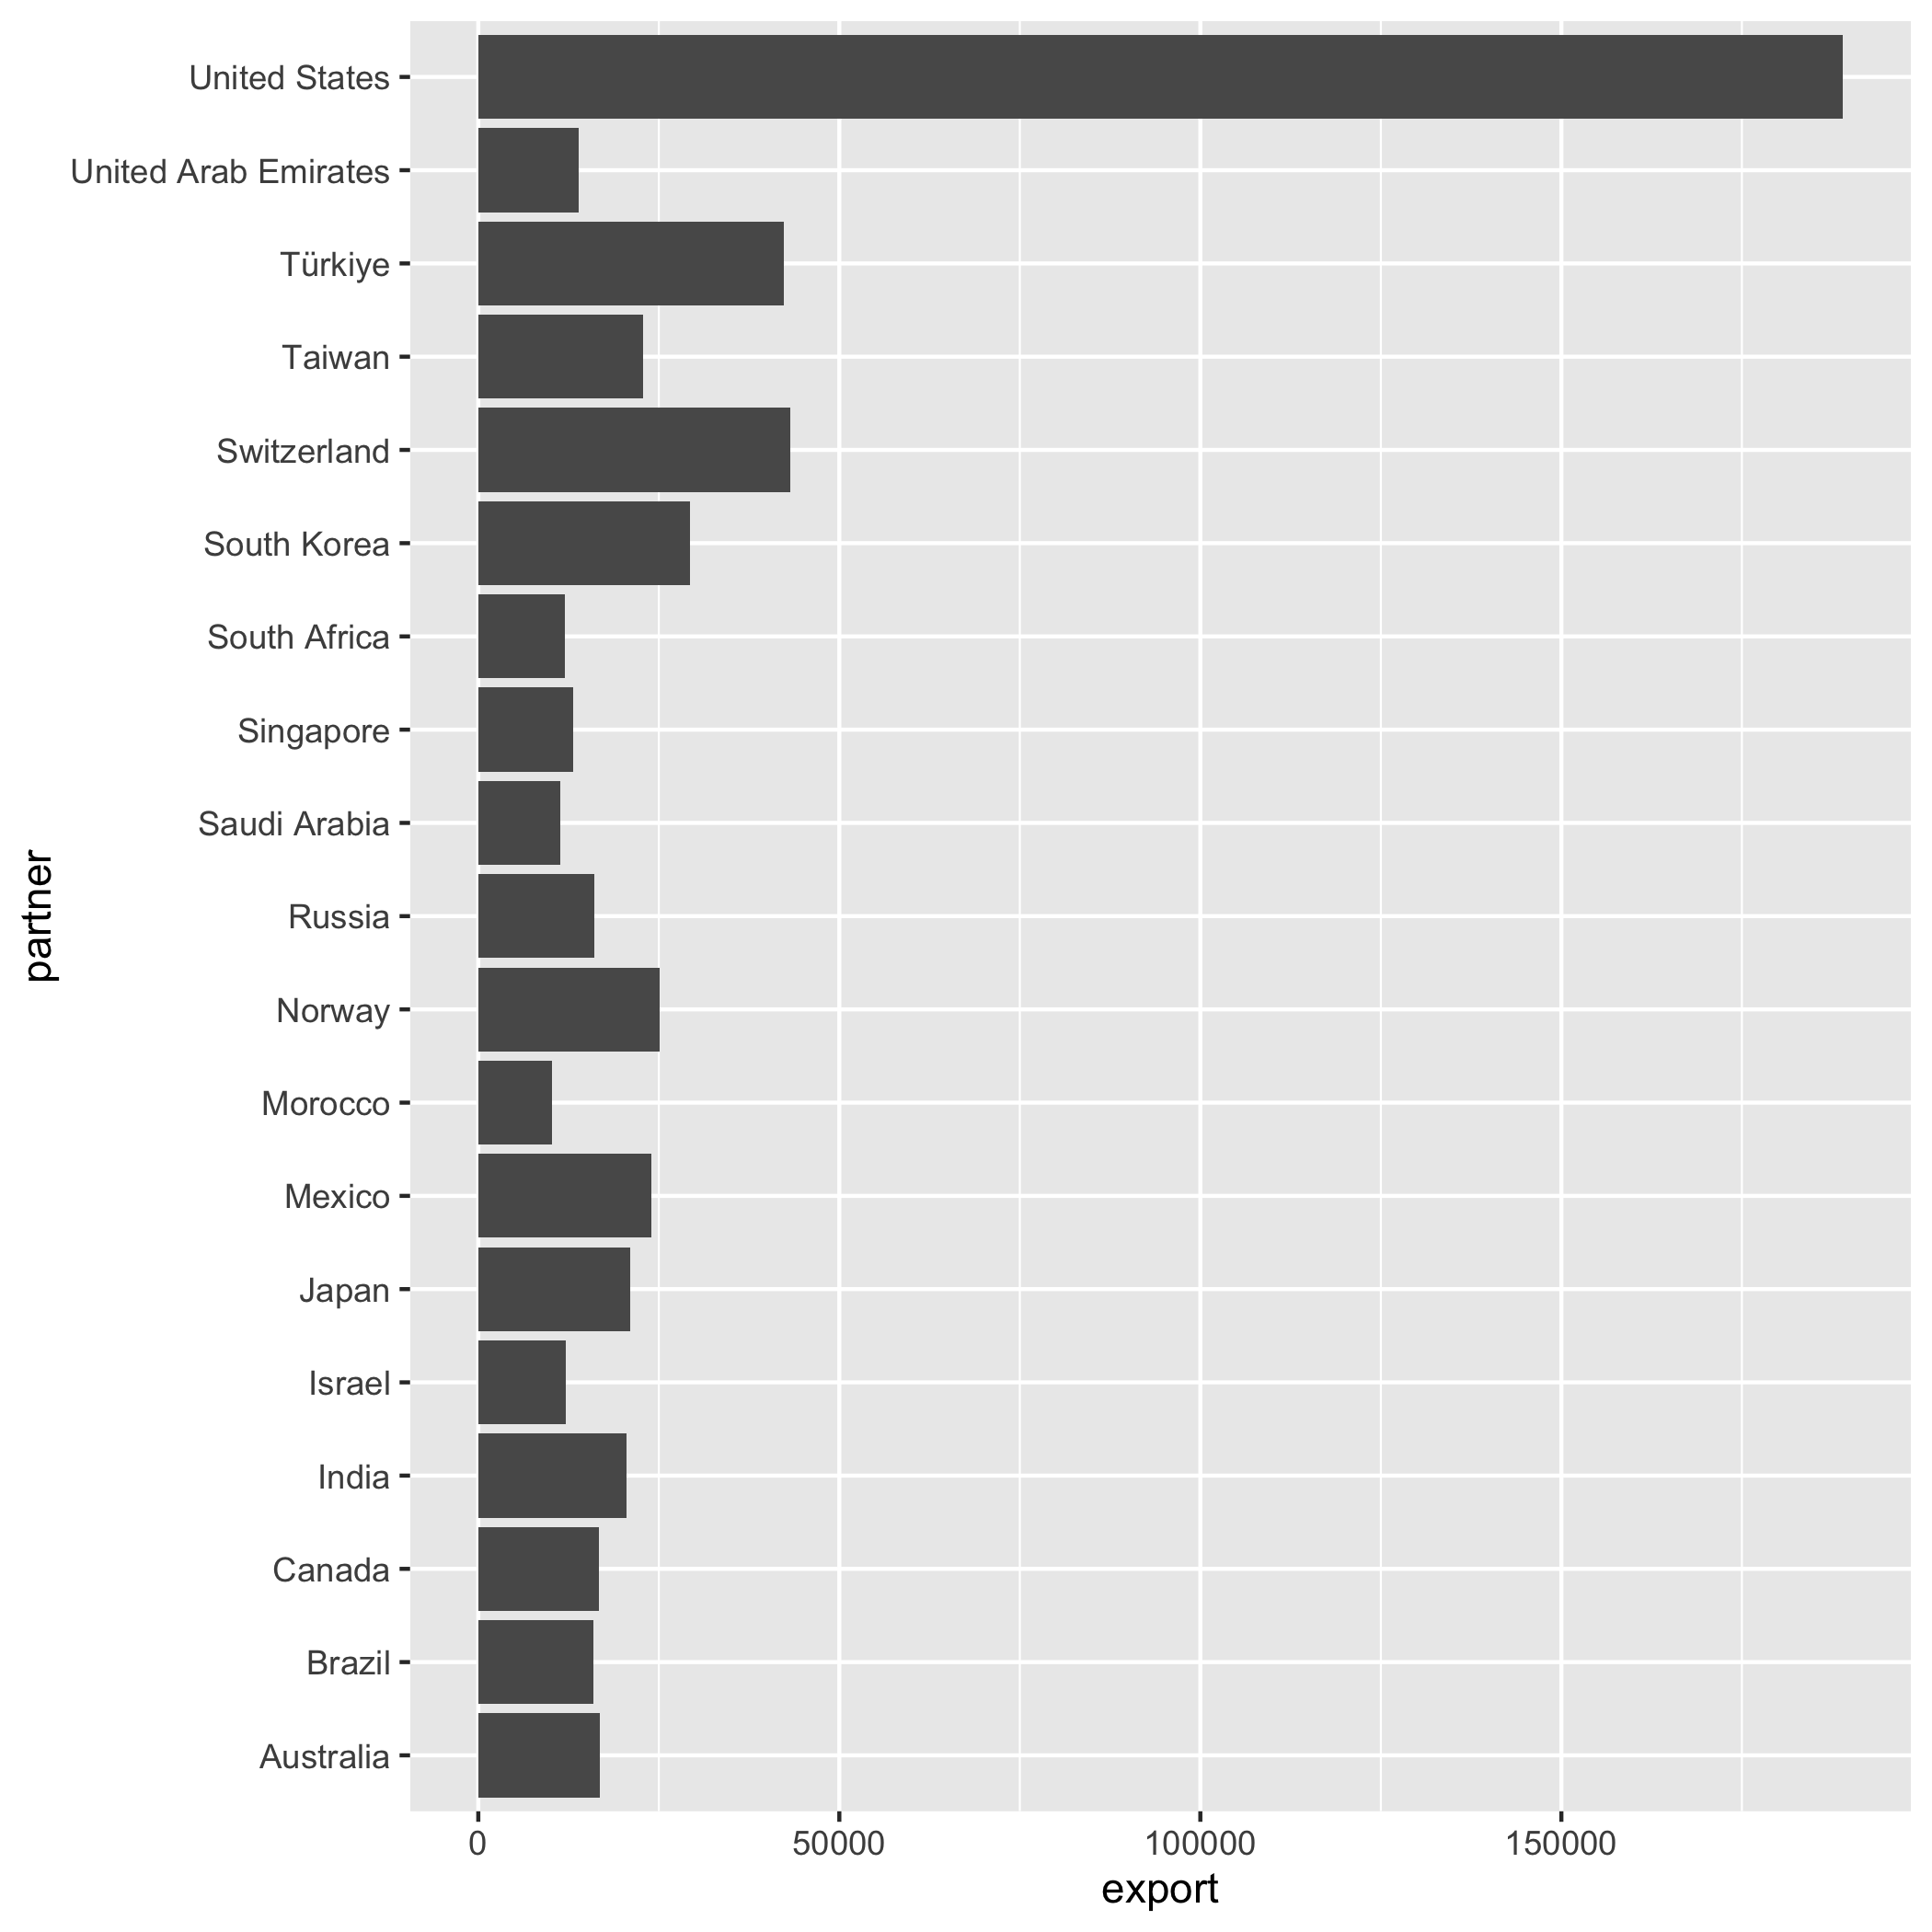<!-- --> ] --- ## Графические переменные Функция `aes(...)` отображает переменные данных на графические переменные ``` r # один цвет для графика (параметр за пределами aes) ggplot(trades_total) + geom_line(mapping = aes(x = time, y = export), color = 'blue') ``` <!-- --> --- ## Графические переменные ``` r trade_russia = trades |> filter(partner == 'Russia') ggplot(trade_russia) + # у каждой группы данных свой цвет geom_line(mapping = aes(x = time, y = export, color = sitc06)) ``` <!-- --> --- ## Графические переменные ``` r ggplot(trade_russia, # а теперь и с точками mapping = aes(x = time, y = export, color = sitc06)) + geom_line() + geom_point() ``` <!-- --> --- ## Графические переменные Аналогичным образом работает параметр формы значка: ``` r ggplot(trades_total) + # один значок для графика geom_point(mapping = aes(x = time, y = export), shape = 15) ``` <!-- --> --- ## Графические переменные У каждой группы данных свой значок ``` r ggplot(trade_russia) + geom_point(mapping = aes(x = time, y = export, shape = sitc06)) ``` <!-- --> --- ## Графические переменные Управление размером через `size` и `linewidth`: ``` r ggplot(trades_total, mapping = aes(x = time, y = export)) + geom_point(size = 5) + geom_line(linewidth = 2) ``` <!-- --> --- ## Графические переменные ``` r ggplot(trade_russia, aes(x = time, y = export)) + geom_point(aes(shape = sitc06)) + geom_line(aes(group = sitc06)) # Группировка данных ``` <!-- --> --- ## Графические переменные ``` r ggplot(df, mapping = aes(x = partner, y = export)) + geom_col(fill = 'plum4', color = 'black', linewidth = 0.2) + # цвет coord_flip() ``` <!-- --> --- ## Графические переменные Управление цветом: .code-small[ ``` r df1 = trades |> filter(time == as.Date('2022-01-01')) |> group_by(partner) |> filter(sum(export) > 50000) df1 |> ggplot(mapping = aes(x = partner, y = export, fill = sitc06)) + # цвет geom_col(color = 'black', size = 0.2) + coord_flip() ``` <!-- --> ] --- ## Графические переменные .code-small[ ``` r df1 |> ggplot(mapping = aes(x = partner, y = export, fill = sitc06)) + geom_col(color = 'black', size = 0.2, position = 'fill') + # проценты coord_flip() ``` <!-- --> ] --- ## Графические переменные Группировка по соседству: .code-small[ ``` r filter(trade_russia, time >= as.Date('2013-01-01')) |> ggplot(mapping = aes(x = time, y = export, fill = sitc06)) + geom_col(color = 'black', size = 0.2, position = 'dodge') ``` <!-- --> ] --- ## Системы координат .pull-left[ Перестановка осей через `coord_flip()`: ``` r trades_type = trades |> group_by(sitc06, time) |> summarise(export = sum(export), import = sum(import)) |> arrange(sitc06, time) ggplot(trades_type) + geom_point(mapping = aes( x = export, y = import, color = sitc06, size = time ), alpha = 0.5 ) + geom_path(mapping = aes( x = export, y = import, group = sitc06 )) + coord_flip() ``` ] .pull-right[ 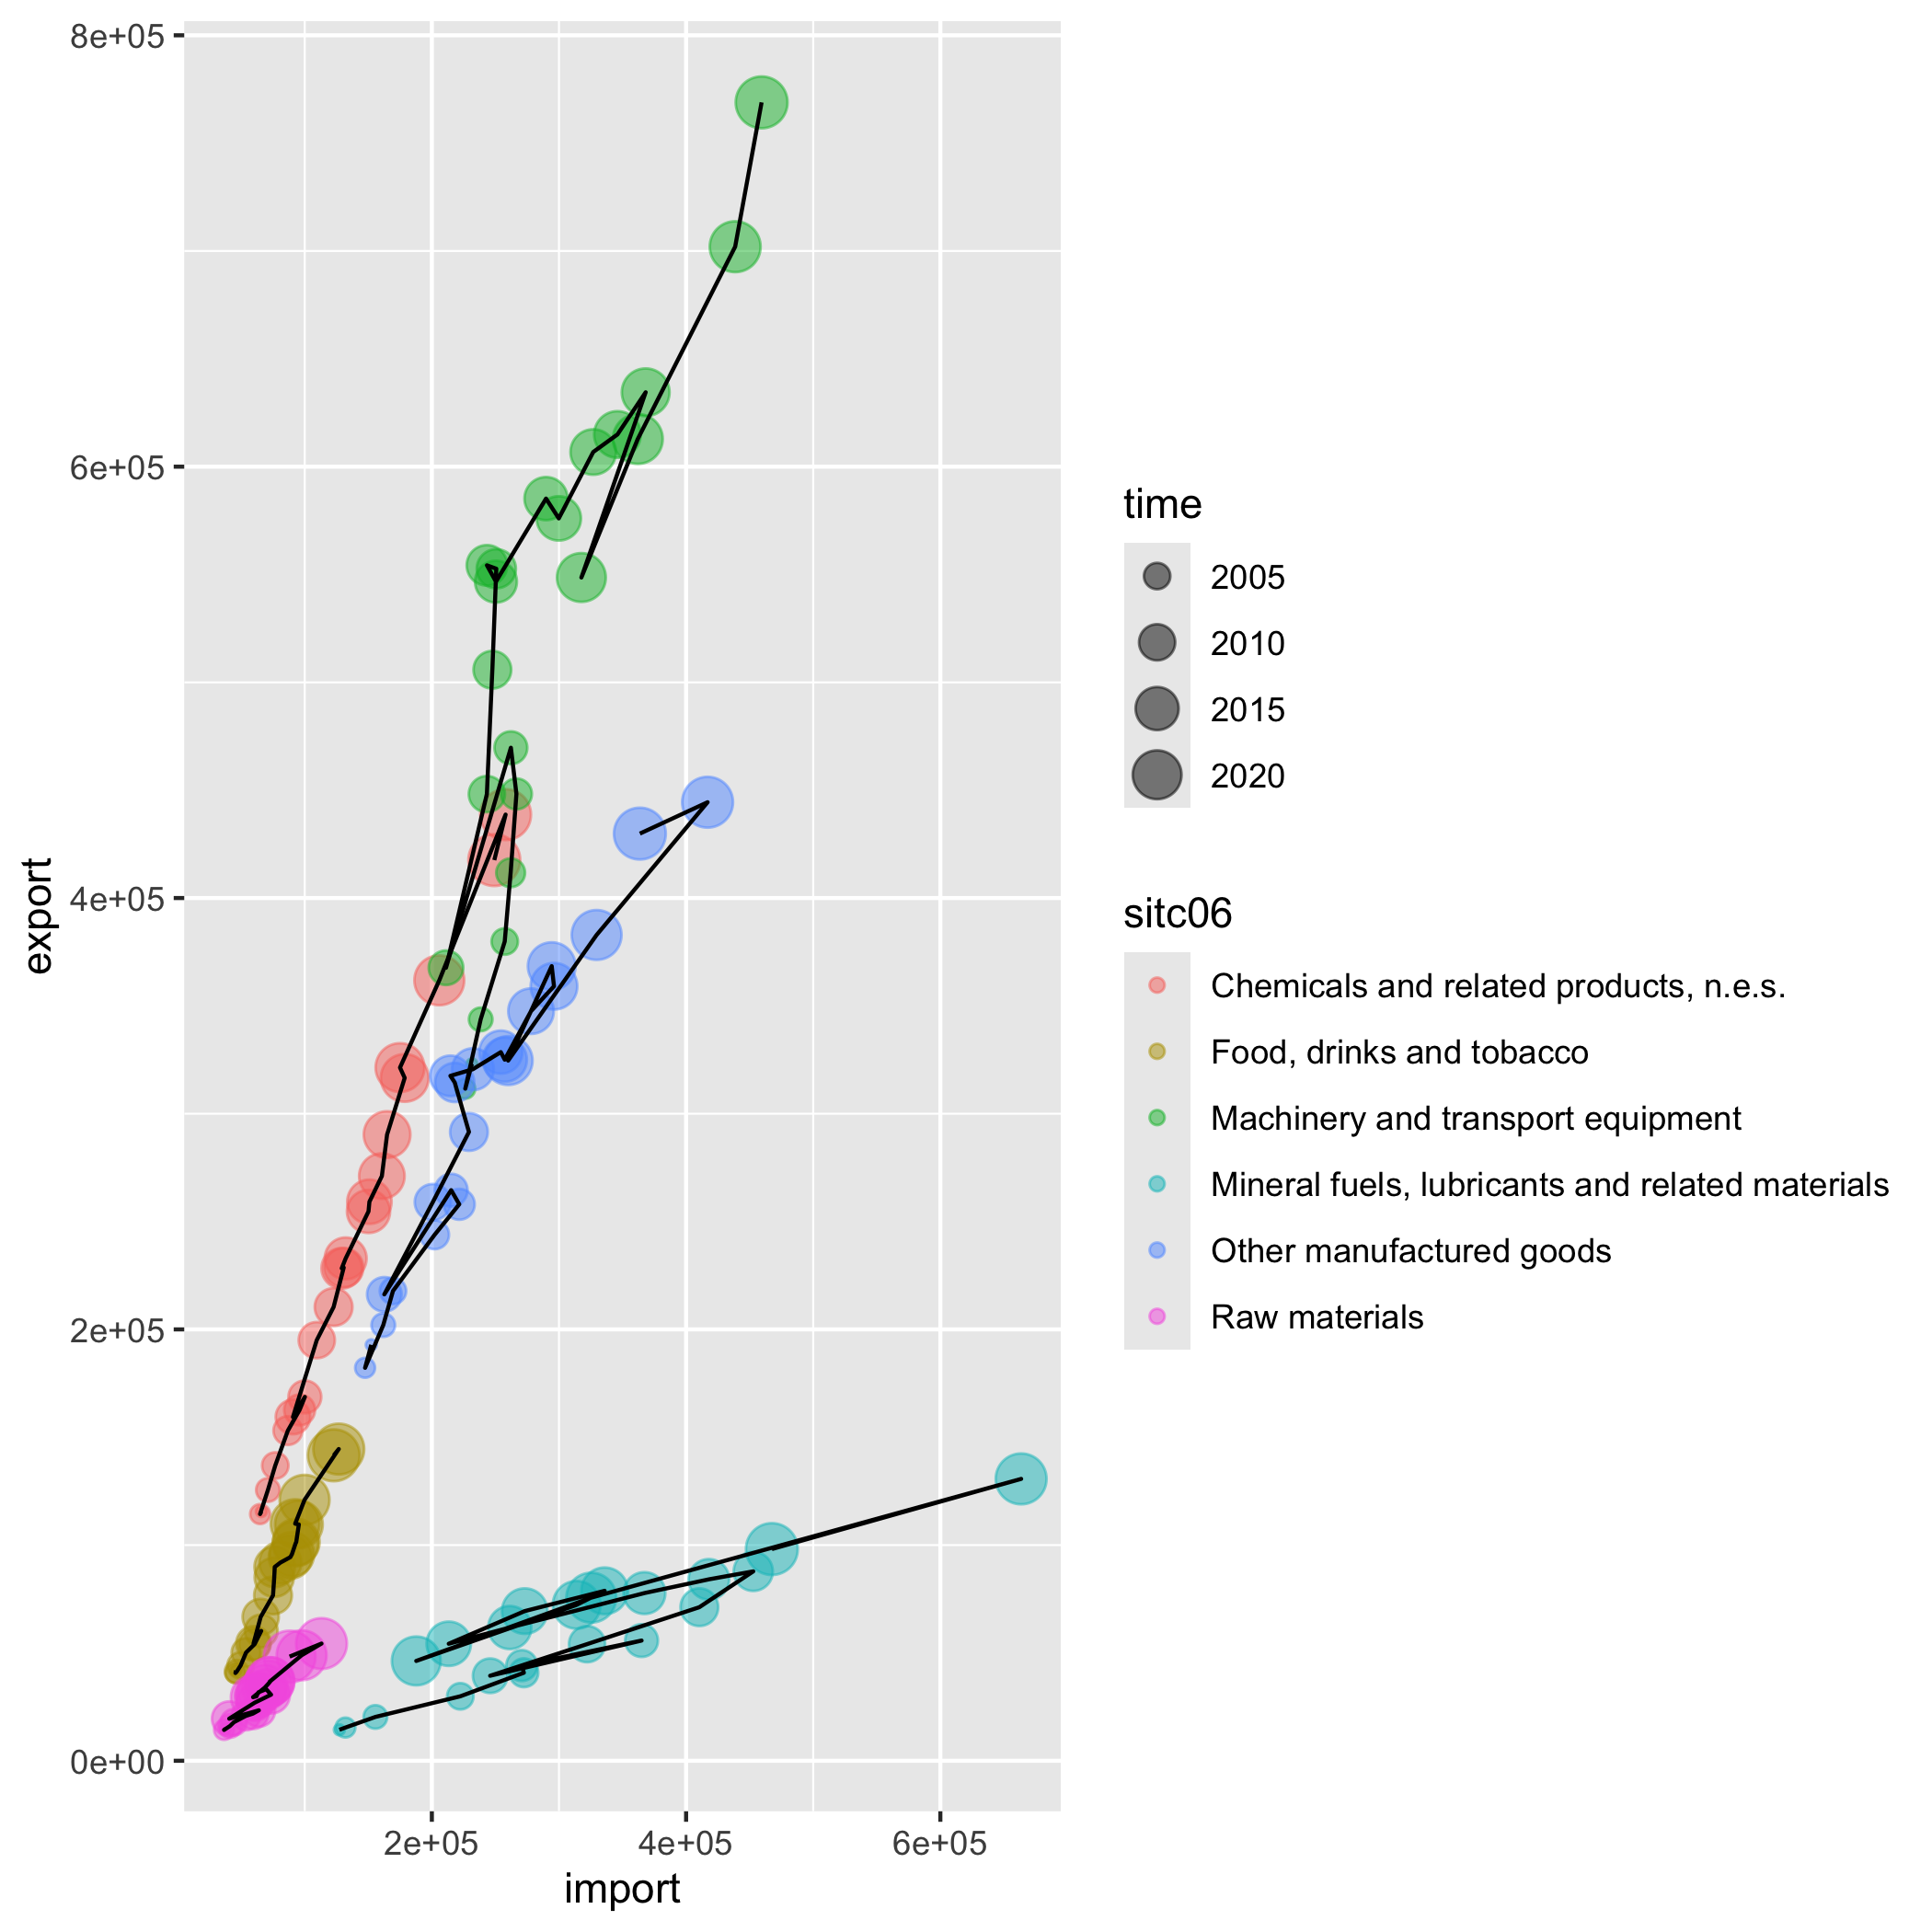<!-- --> ] --- ## Системы координат .left-40[ Логарифмирование: ``` r ggplot(trades_type) + geom_point(mapping = aes( x = export, y = import, color = sitc06, size = time ), alpha = 0.5) + geom_path(mapping = aes( x = export, y = import, group = sitc06 )) + scale_x_log10() + scale_y_log10() ``` ] .right-60[ 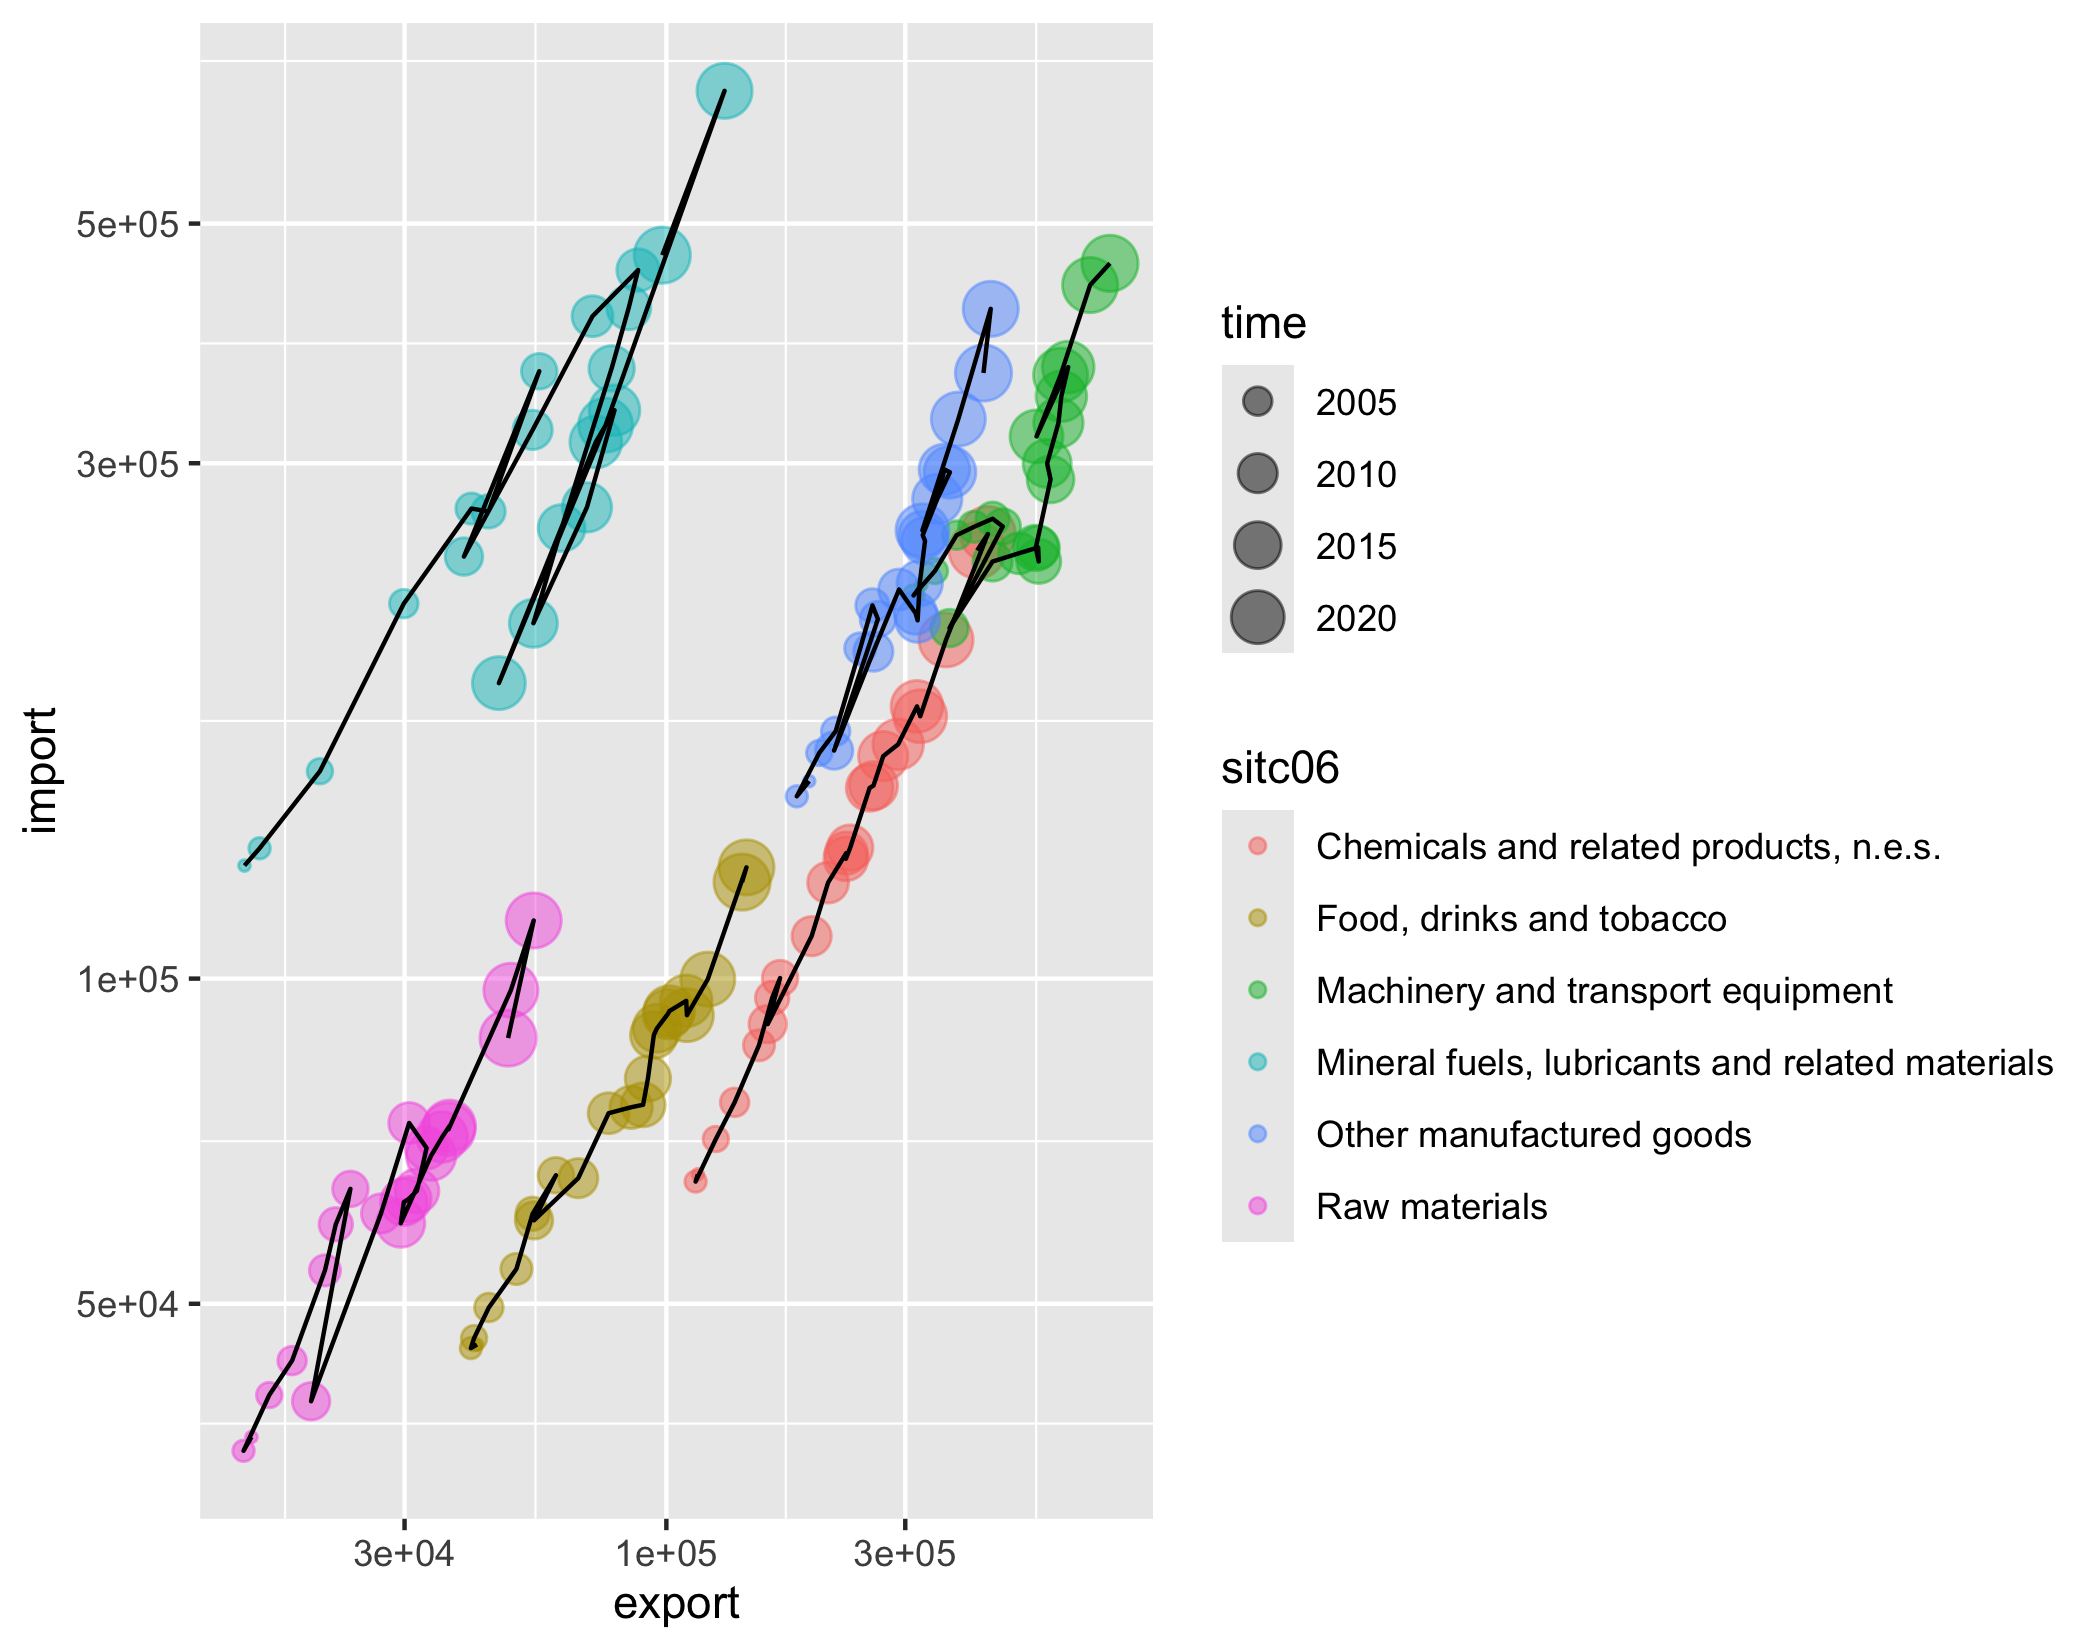<!-- --> ] --- ## Системы координат .left-40[ Полярная система координат: ``` r ggplot( df, mapping = aes( x = partner, y = export, fill = partner ) ) + geom_col() + coord_polar() ``` ] .right-60[ 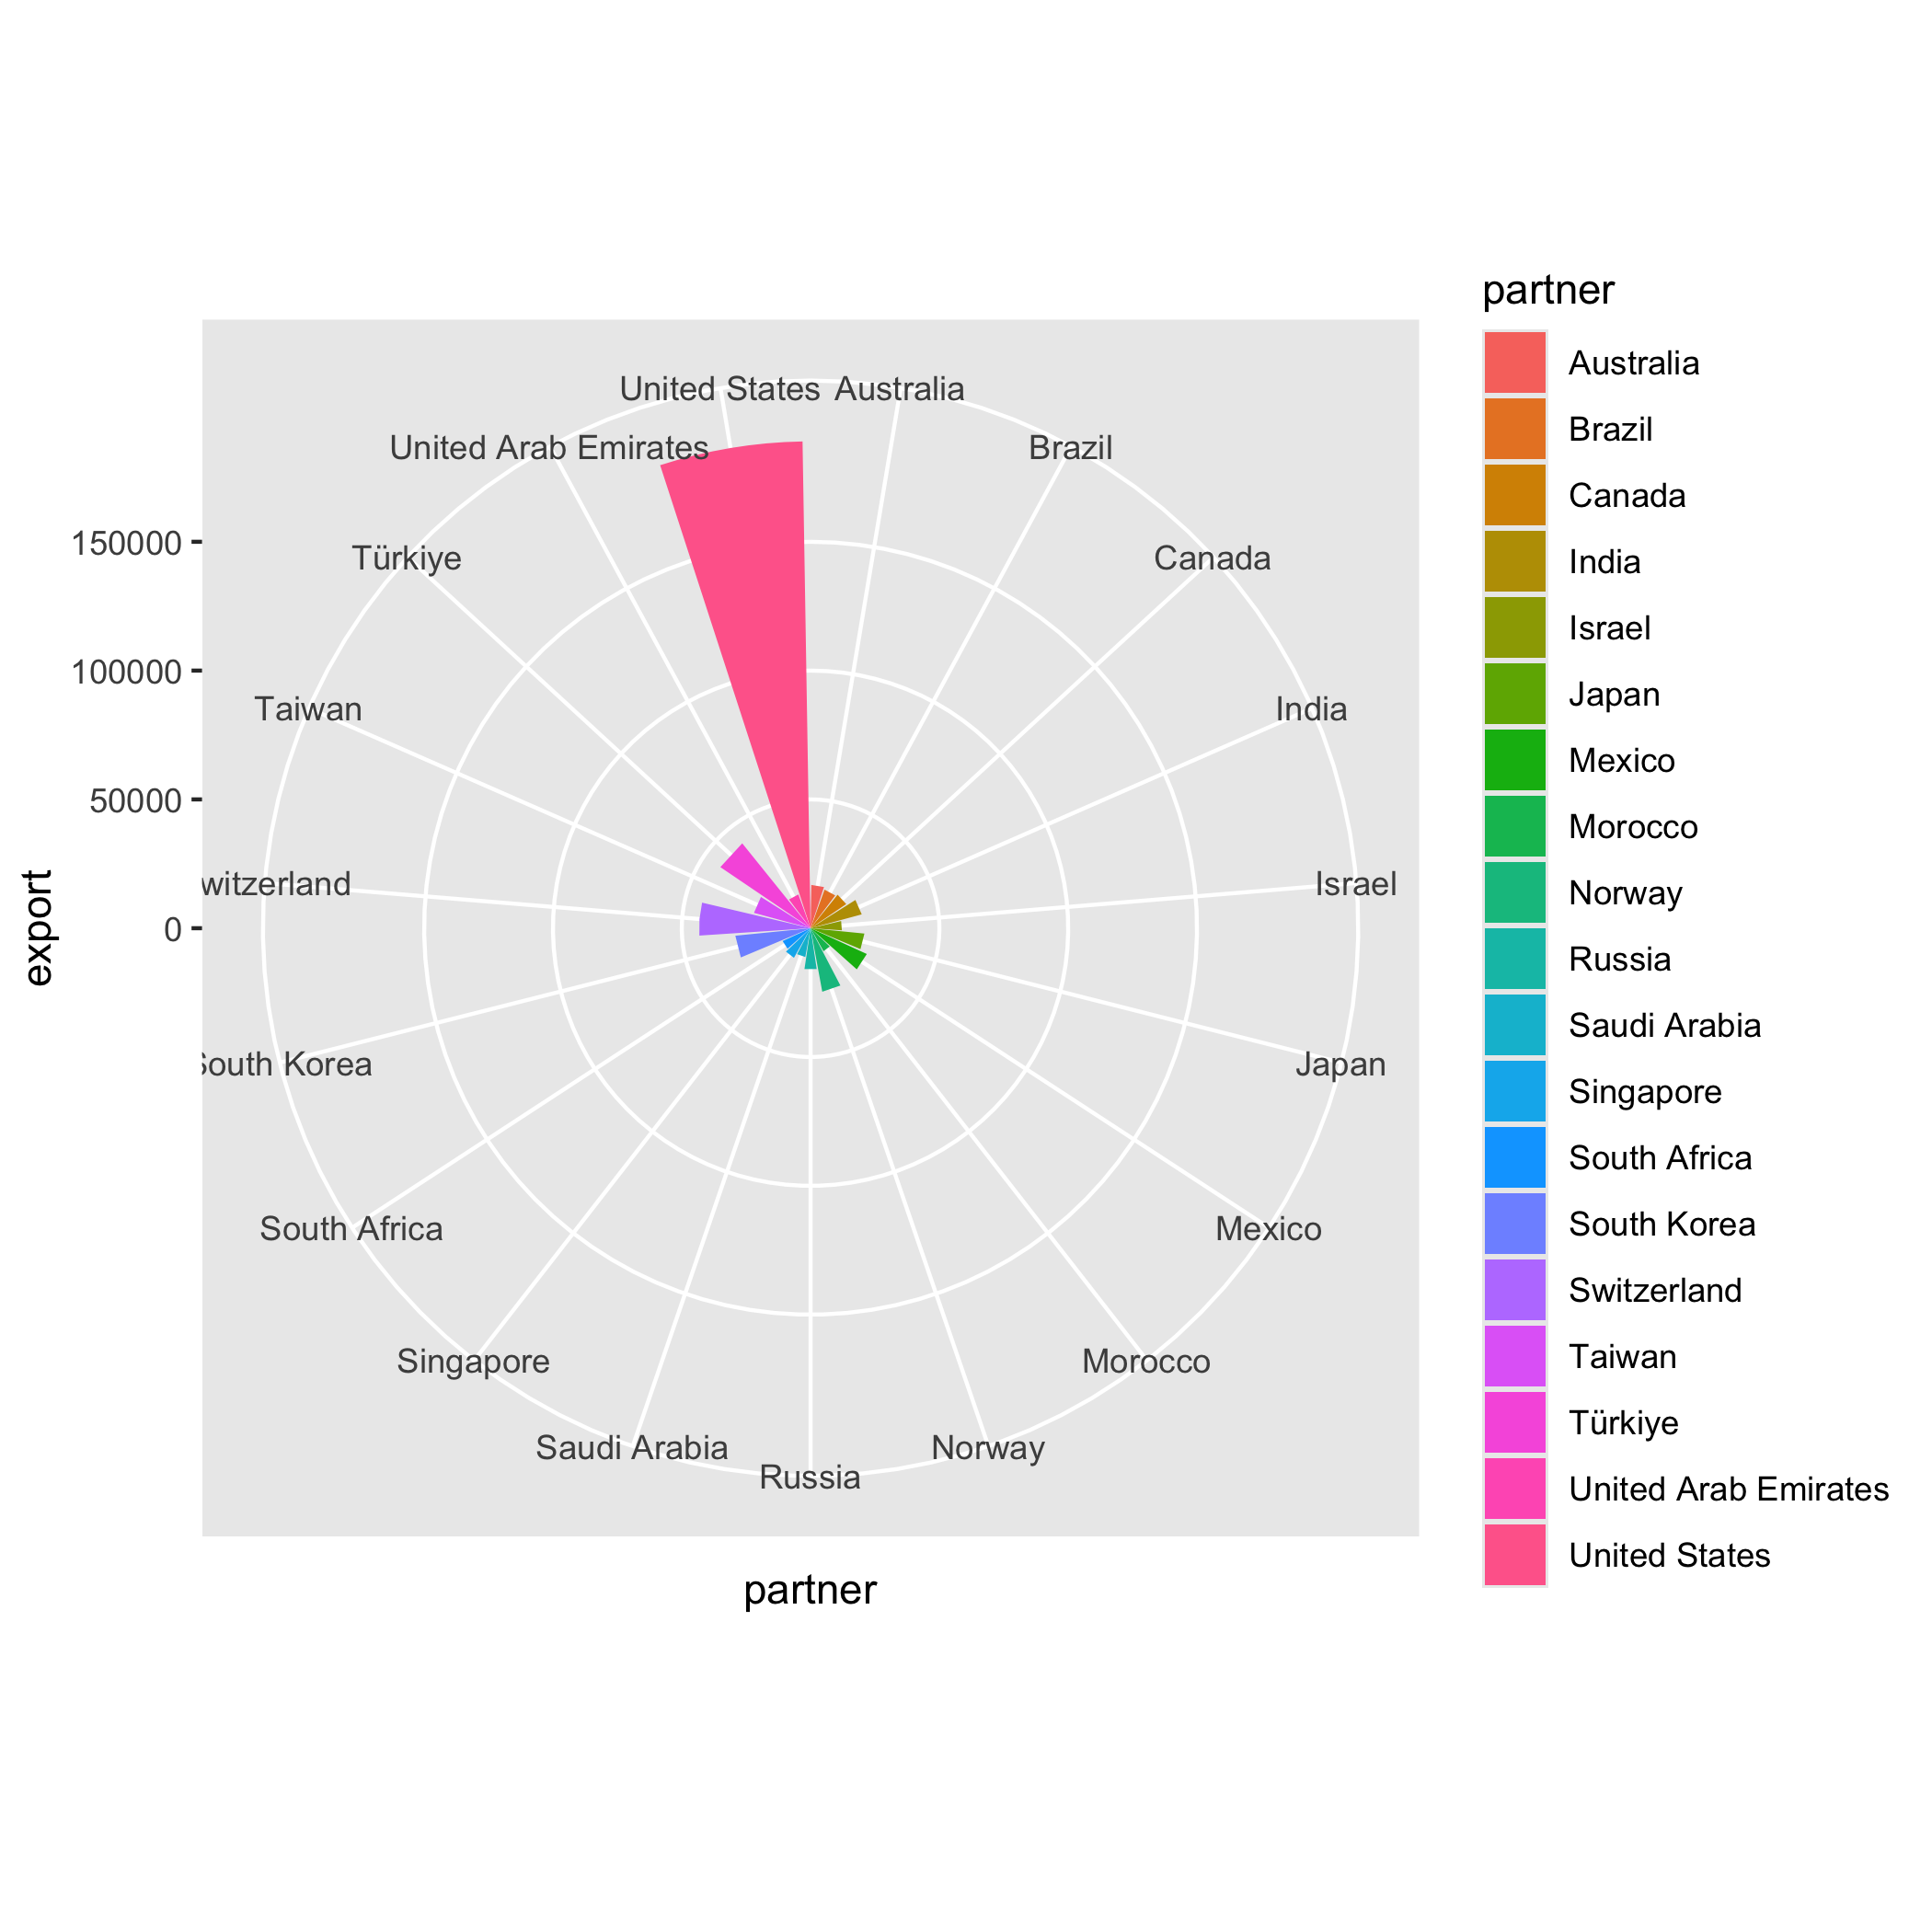<!-- --> ] --- ## Системы координат .left-40[ Преобразование квадратного корня: ``` r ggplot( df, mapping = aes( x = partner, y = export, fill = partner ) ) + geom_col() + coord_polar() + scale_y_sqrt() ``` ] .right-60[ 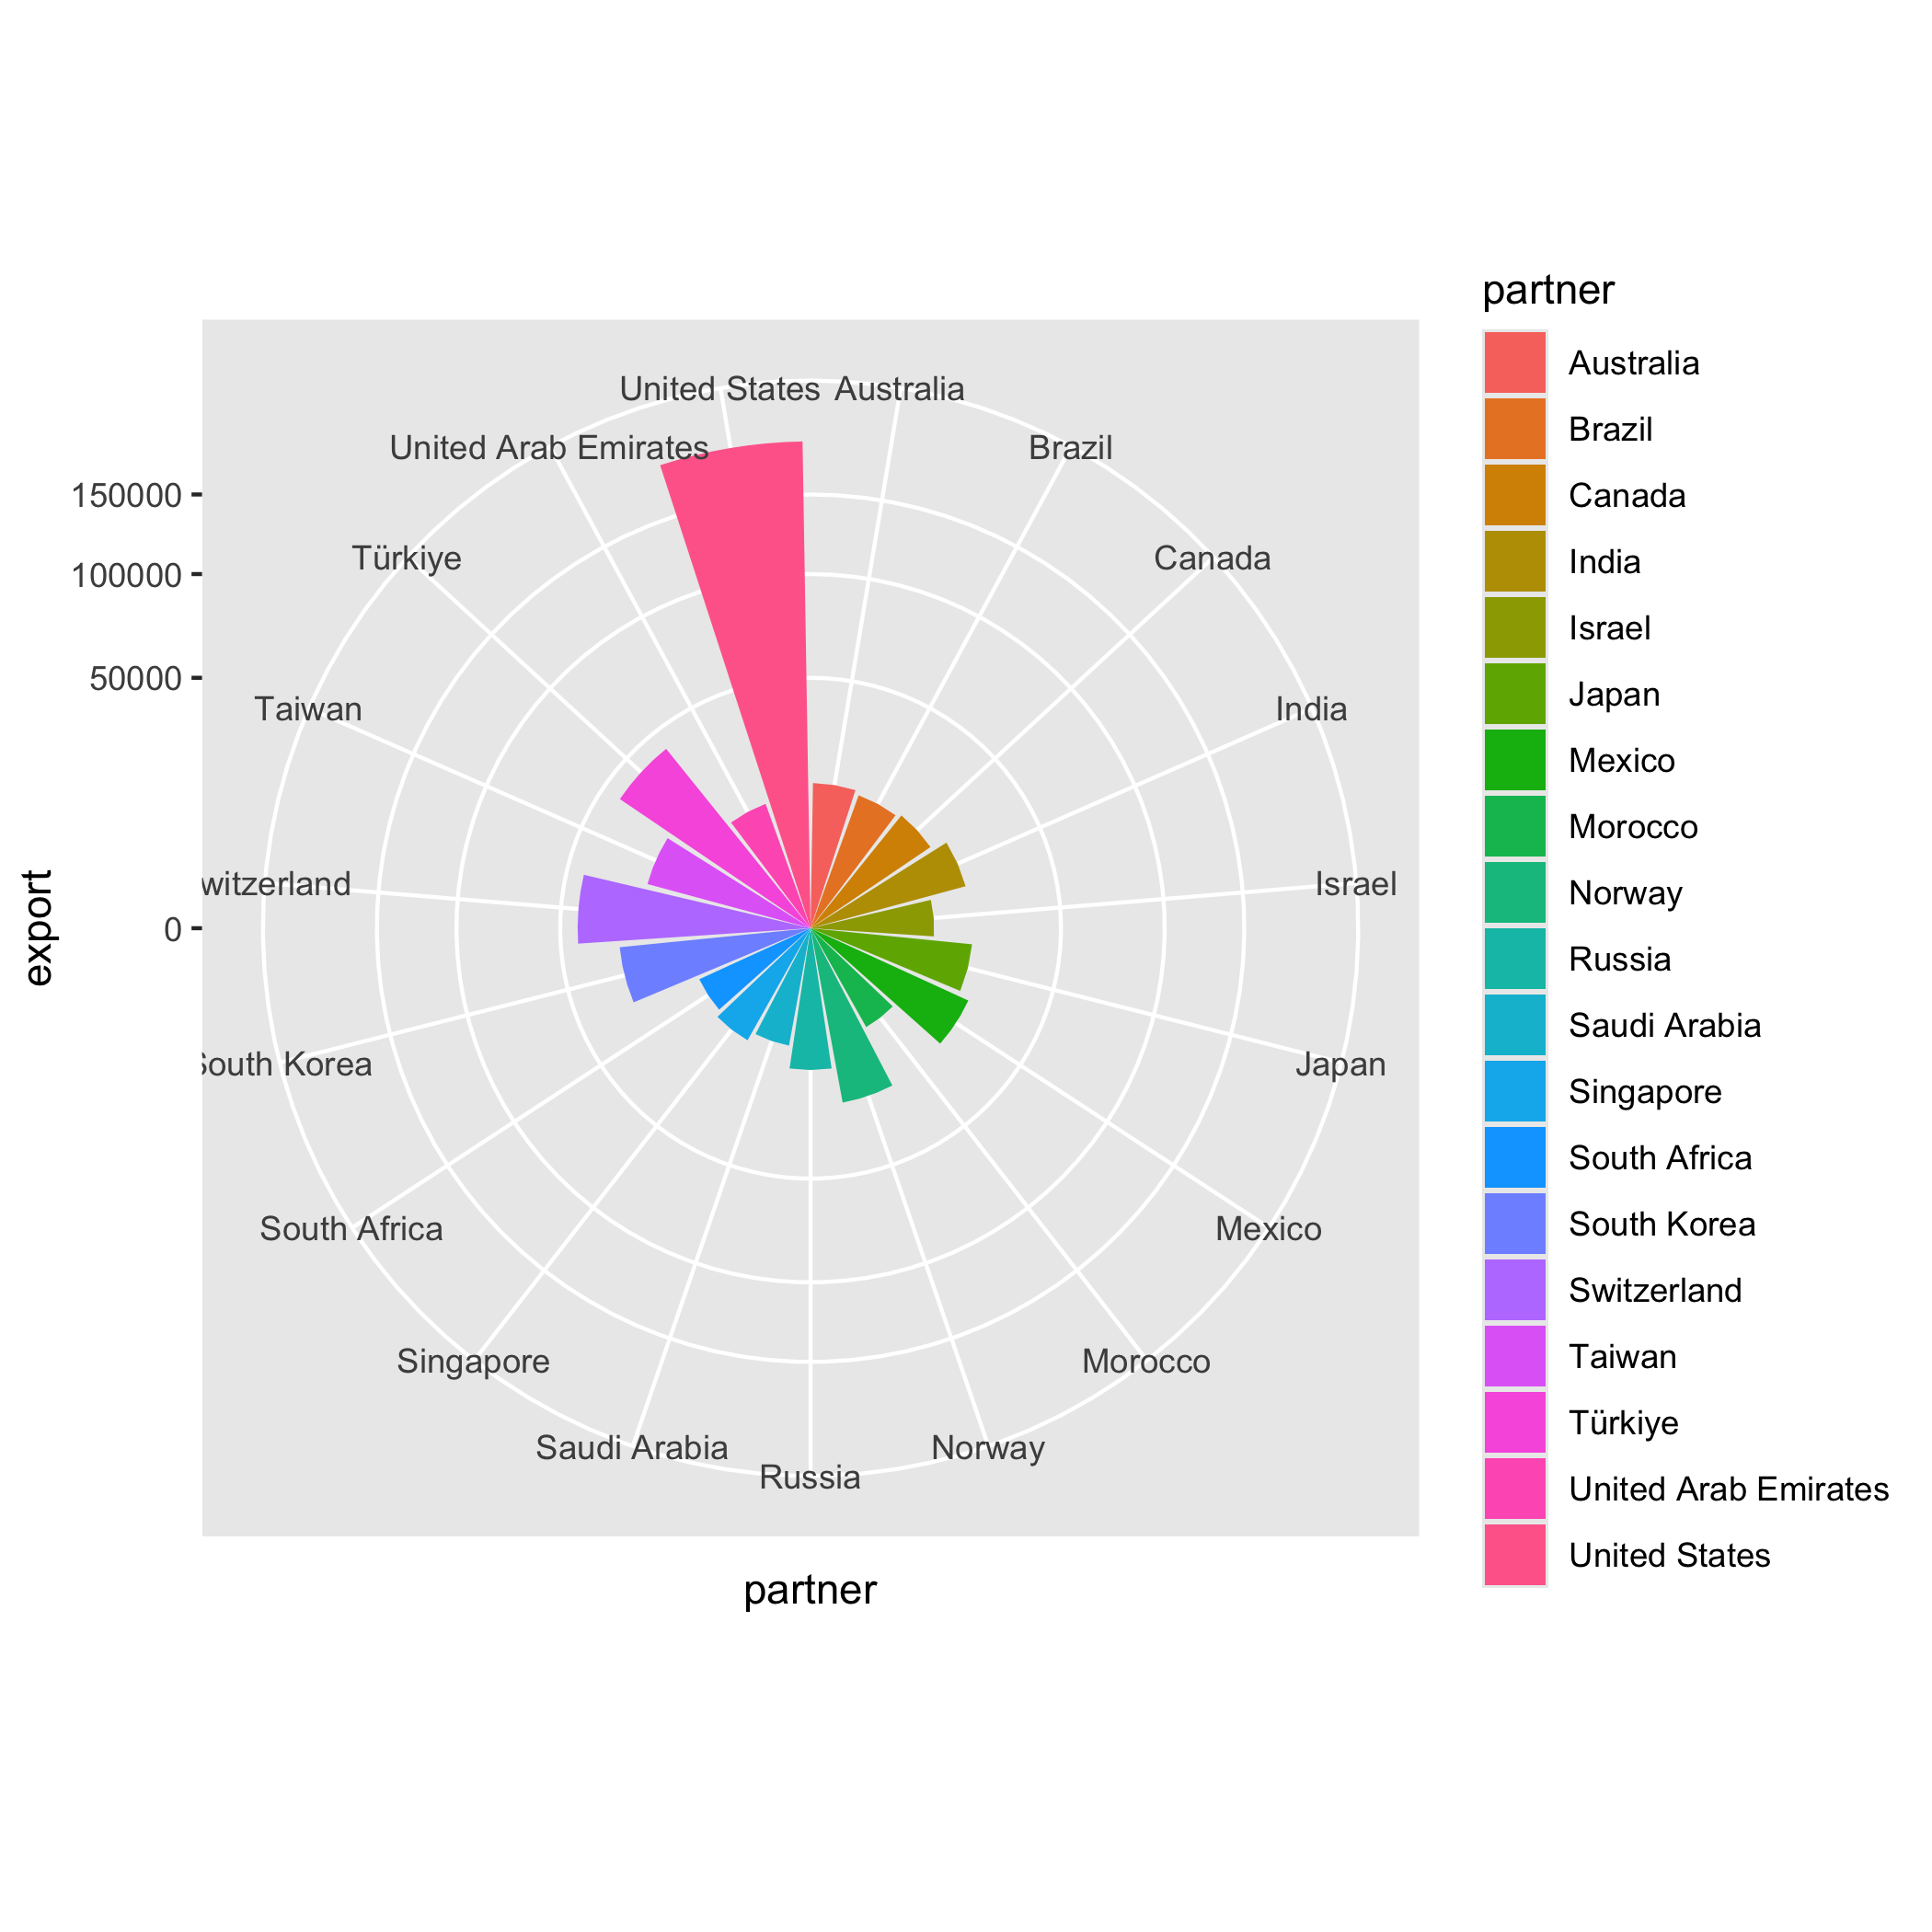<!-- --> ] --- ## Системы координат .pull-left[ Классическая секторная диаграмма: ``` r ggplot( df, mapping = aes( x = '', y = export, fill = partner ) ) + geom_col( color = 'black', linewidth = 0.2 ) + coord_polar(theta = 'y') ``` ] .pull-right[ 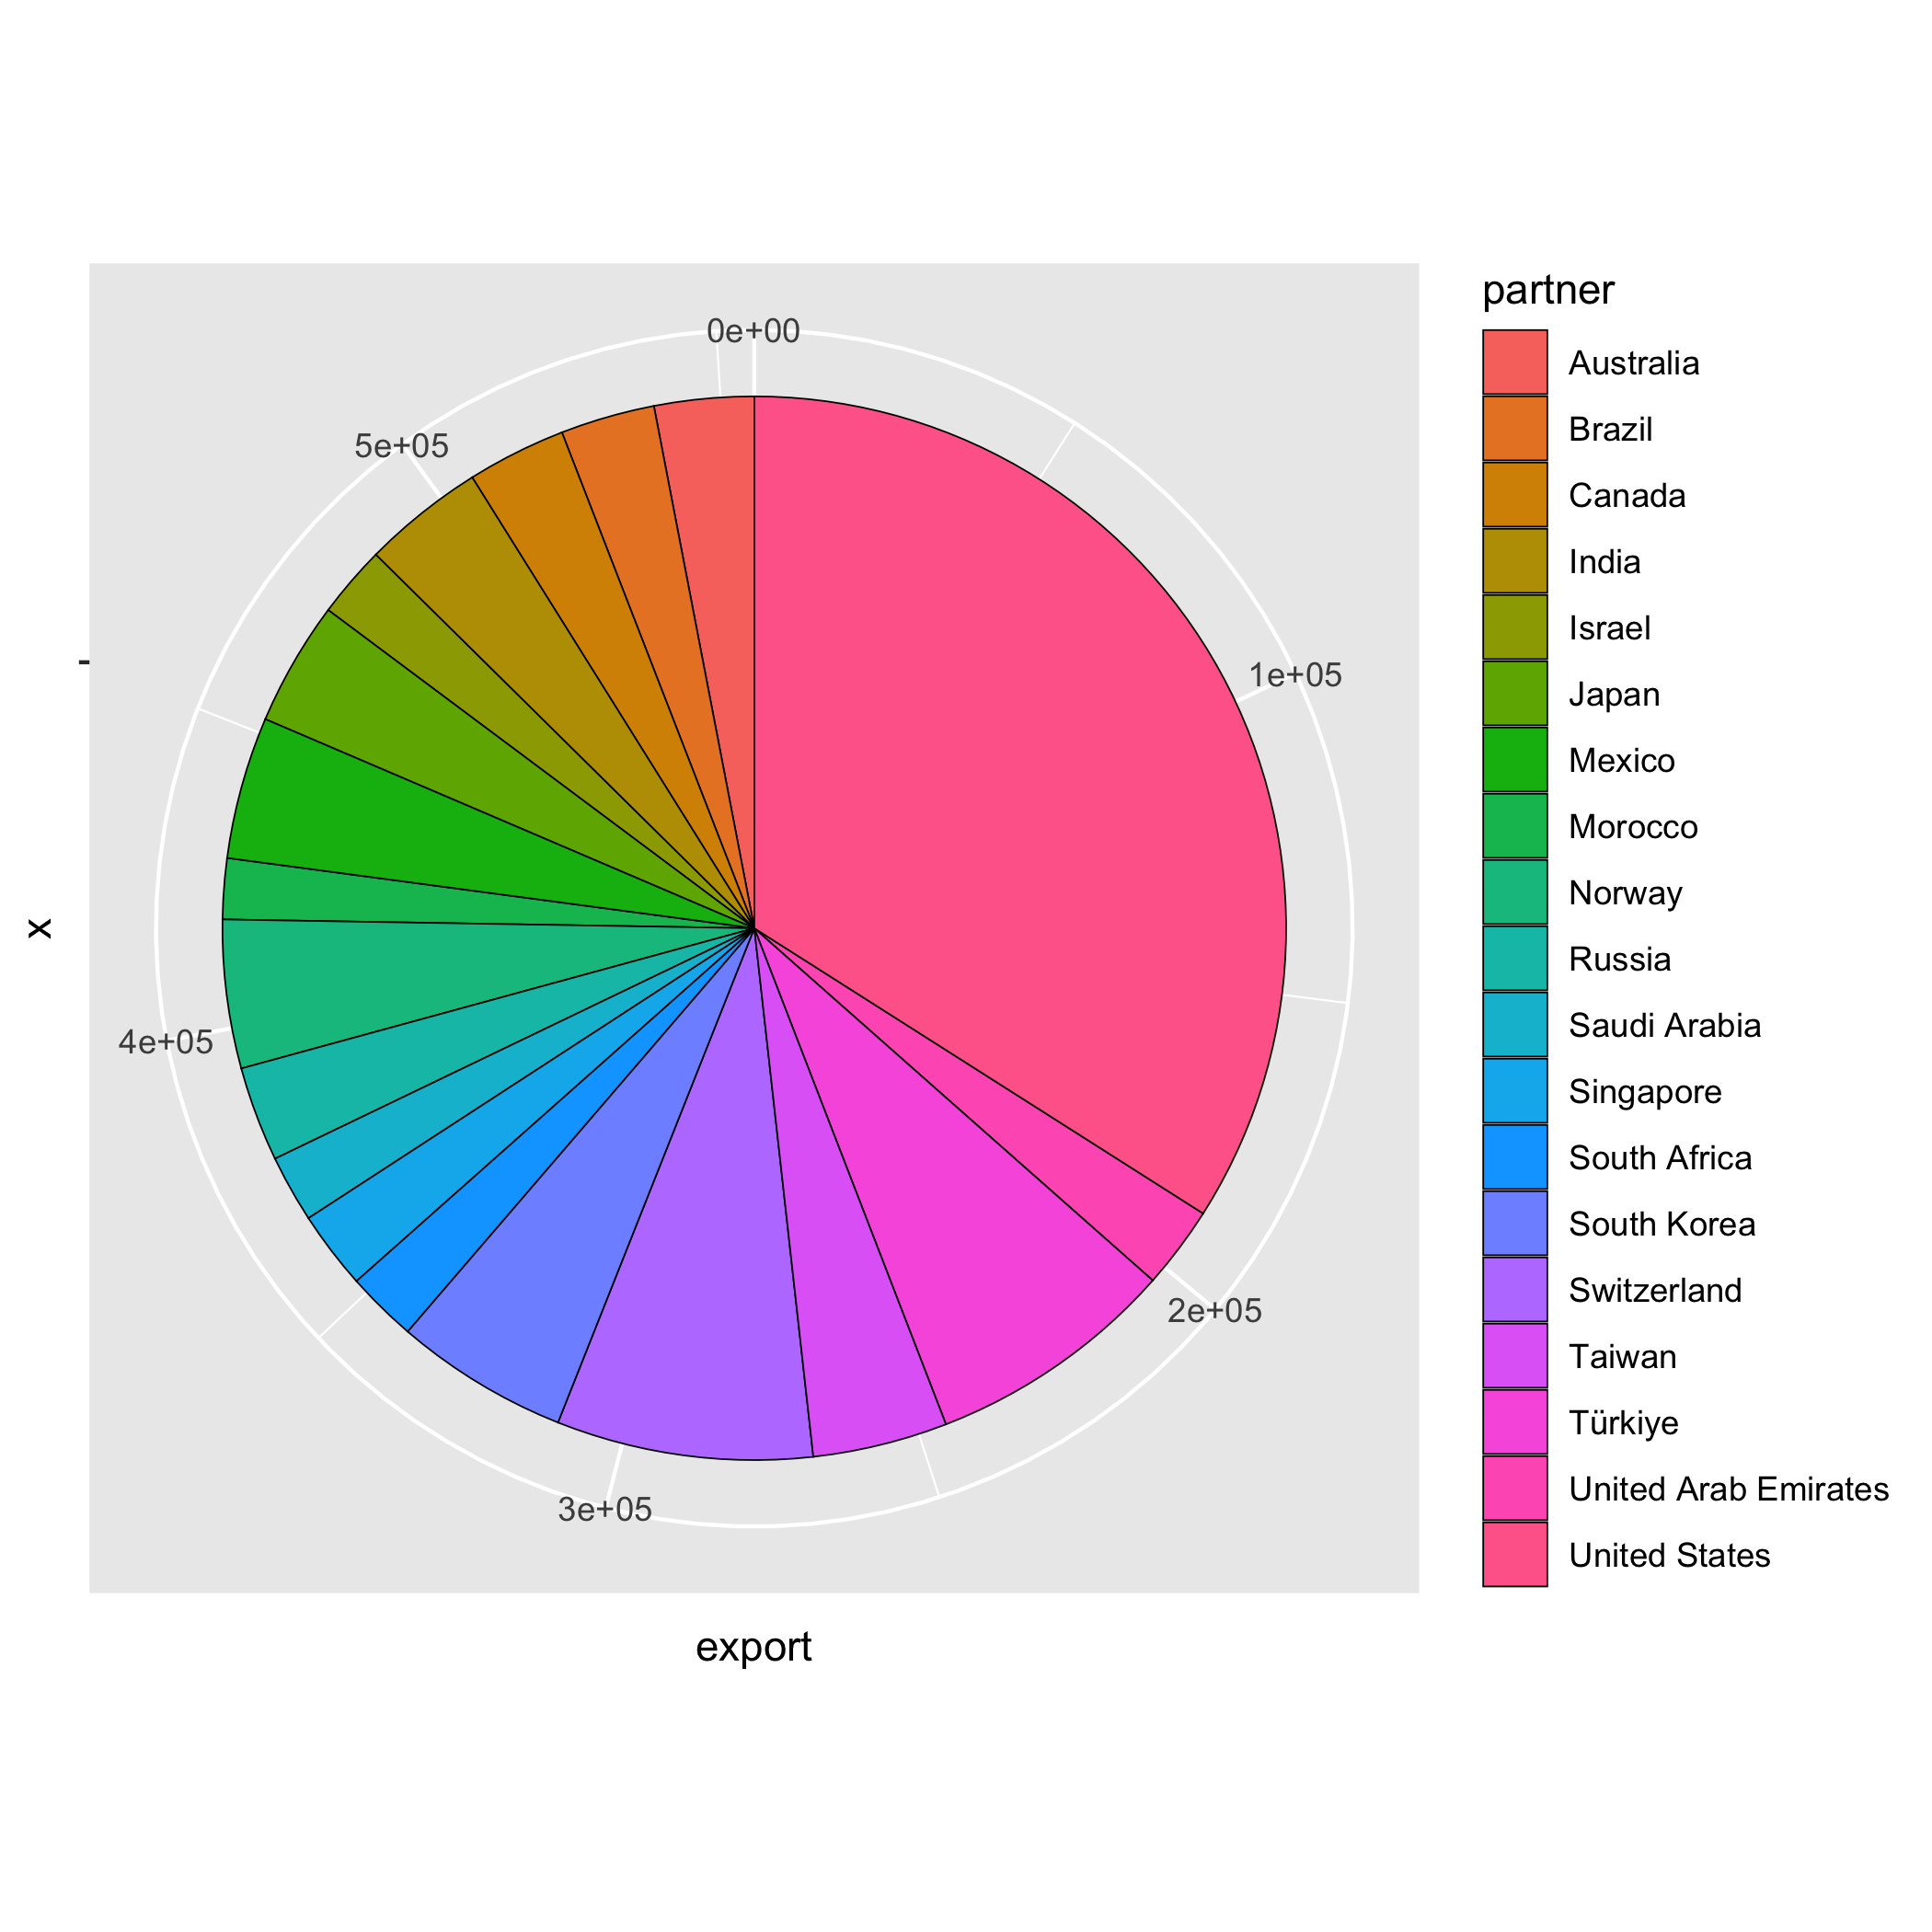<!-- --> ] --- ## Названия осей и легенды .pull-left[ .code-small[ ``` r options(scipen = 999) ggplot(trades_type) + geom_point( mapping = aes( x = export, y = import, color = sitc06, size = time ),alpha = 0.5 ) + geom_path(mapping = aes( x = export, y = import, group = sitc06) ) + labs(color = "Вид продукции", size = 'Год') + ggtitle('Соотношение импорта и экспорта в странах Евросоюза (млн долл. США)', subtitle = 'Данные по ключевым партнерам') + xlab('Экспорт') + ylab('Импорт') ``` ] ] .pull-right[ 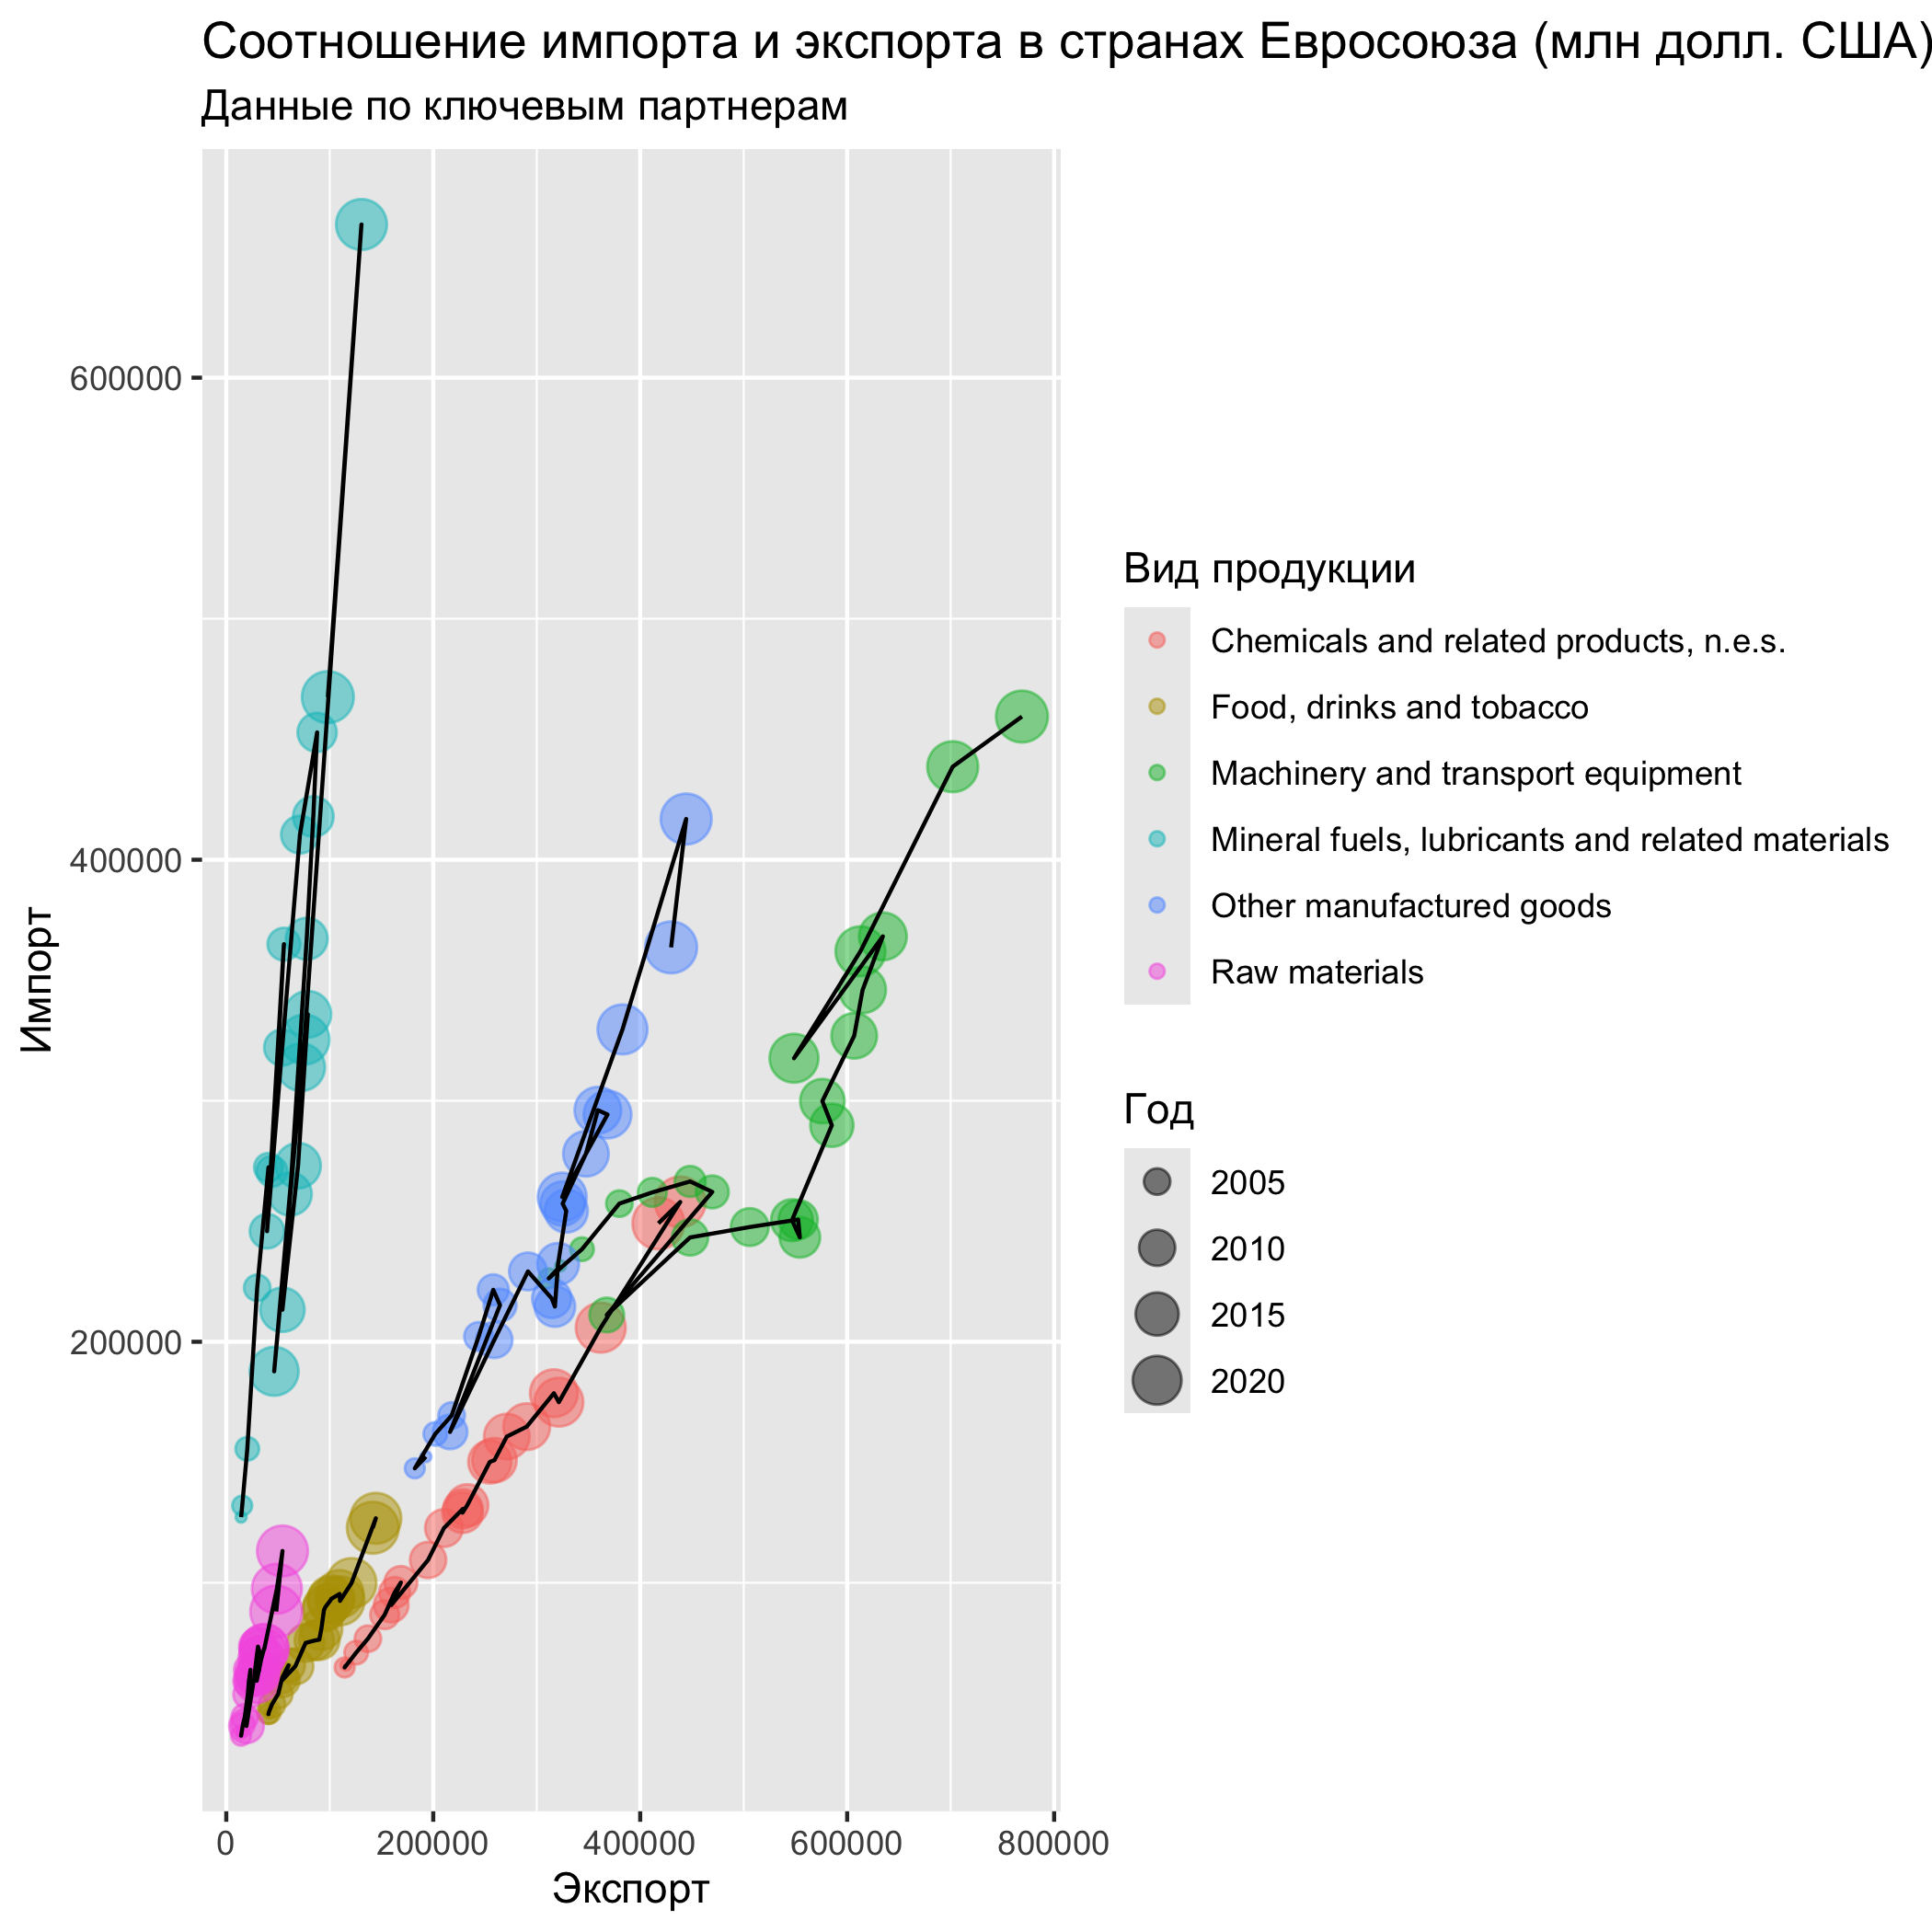<!-- --> ] --- ## Разметка осей .left-40[ .code-small[ ``` r brks = seq(0, 500000, 100000) ggplot(trades_type) + geom_point(mapping = aes( x = export, y = import, color = sitc06, size = time ), alpha = 0.5) + geom_path(mapping = aes( x = export, y = import, group = sitc06) ) + scale_x_log10( breaks = brks, labels = brks / 1000 ) + scale_y_log10( breaks = brks, labels = brks / 1000 ) ``` ] ] .right-60[ 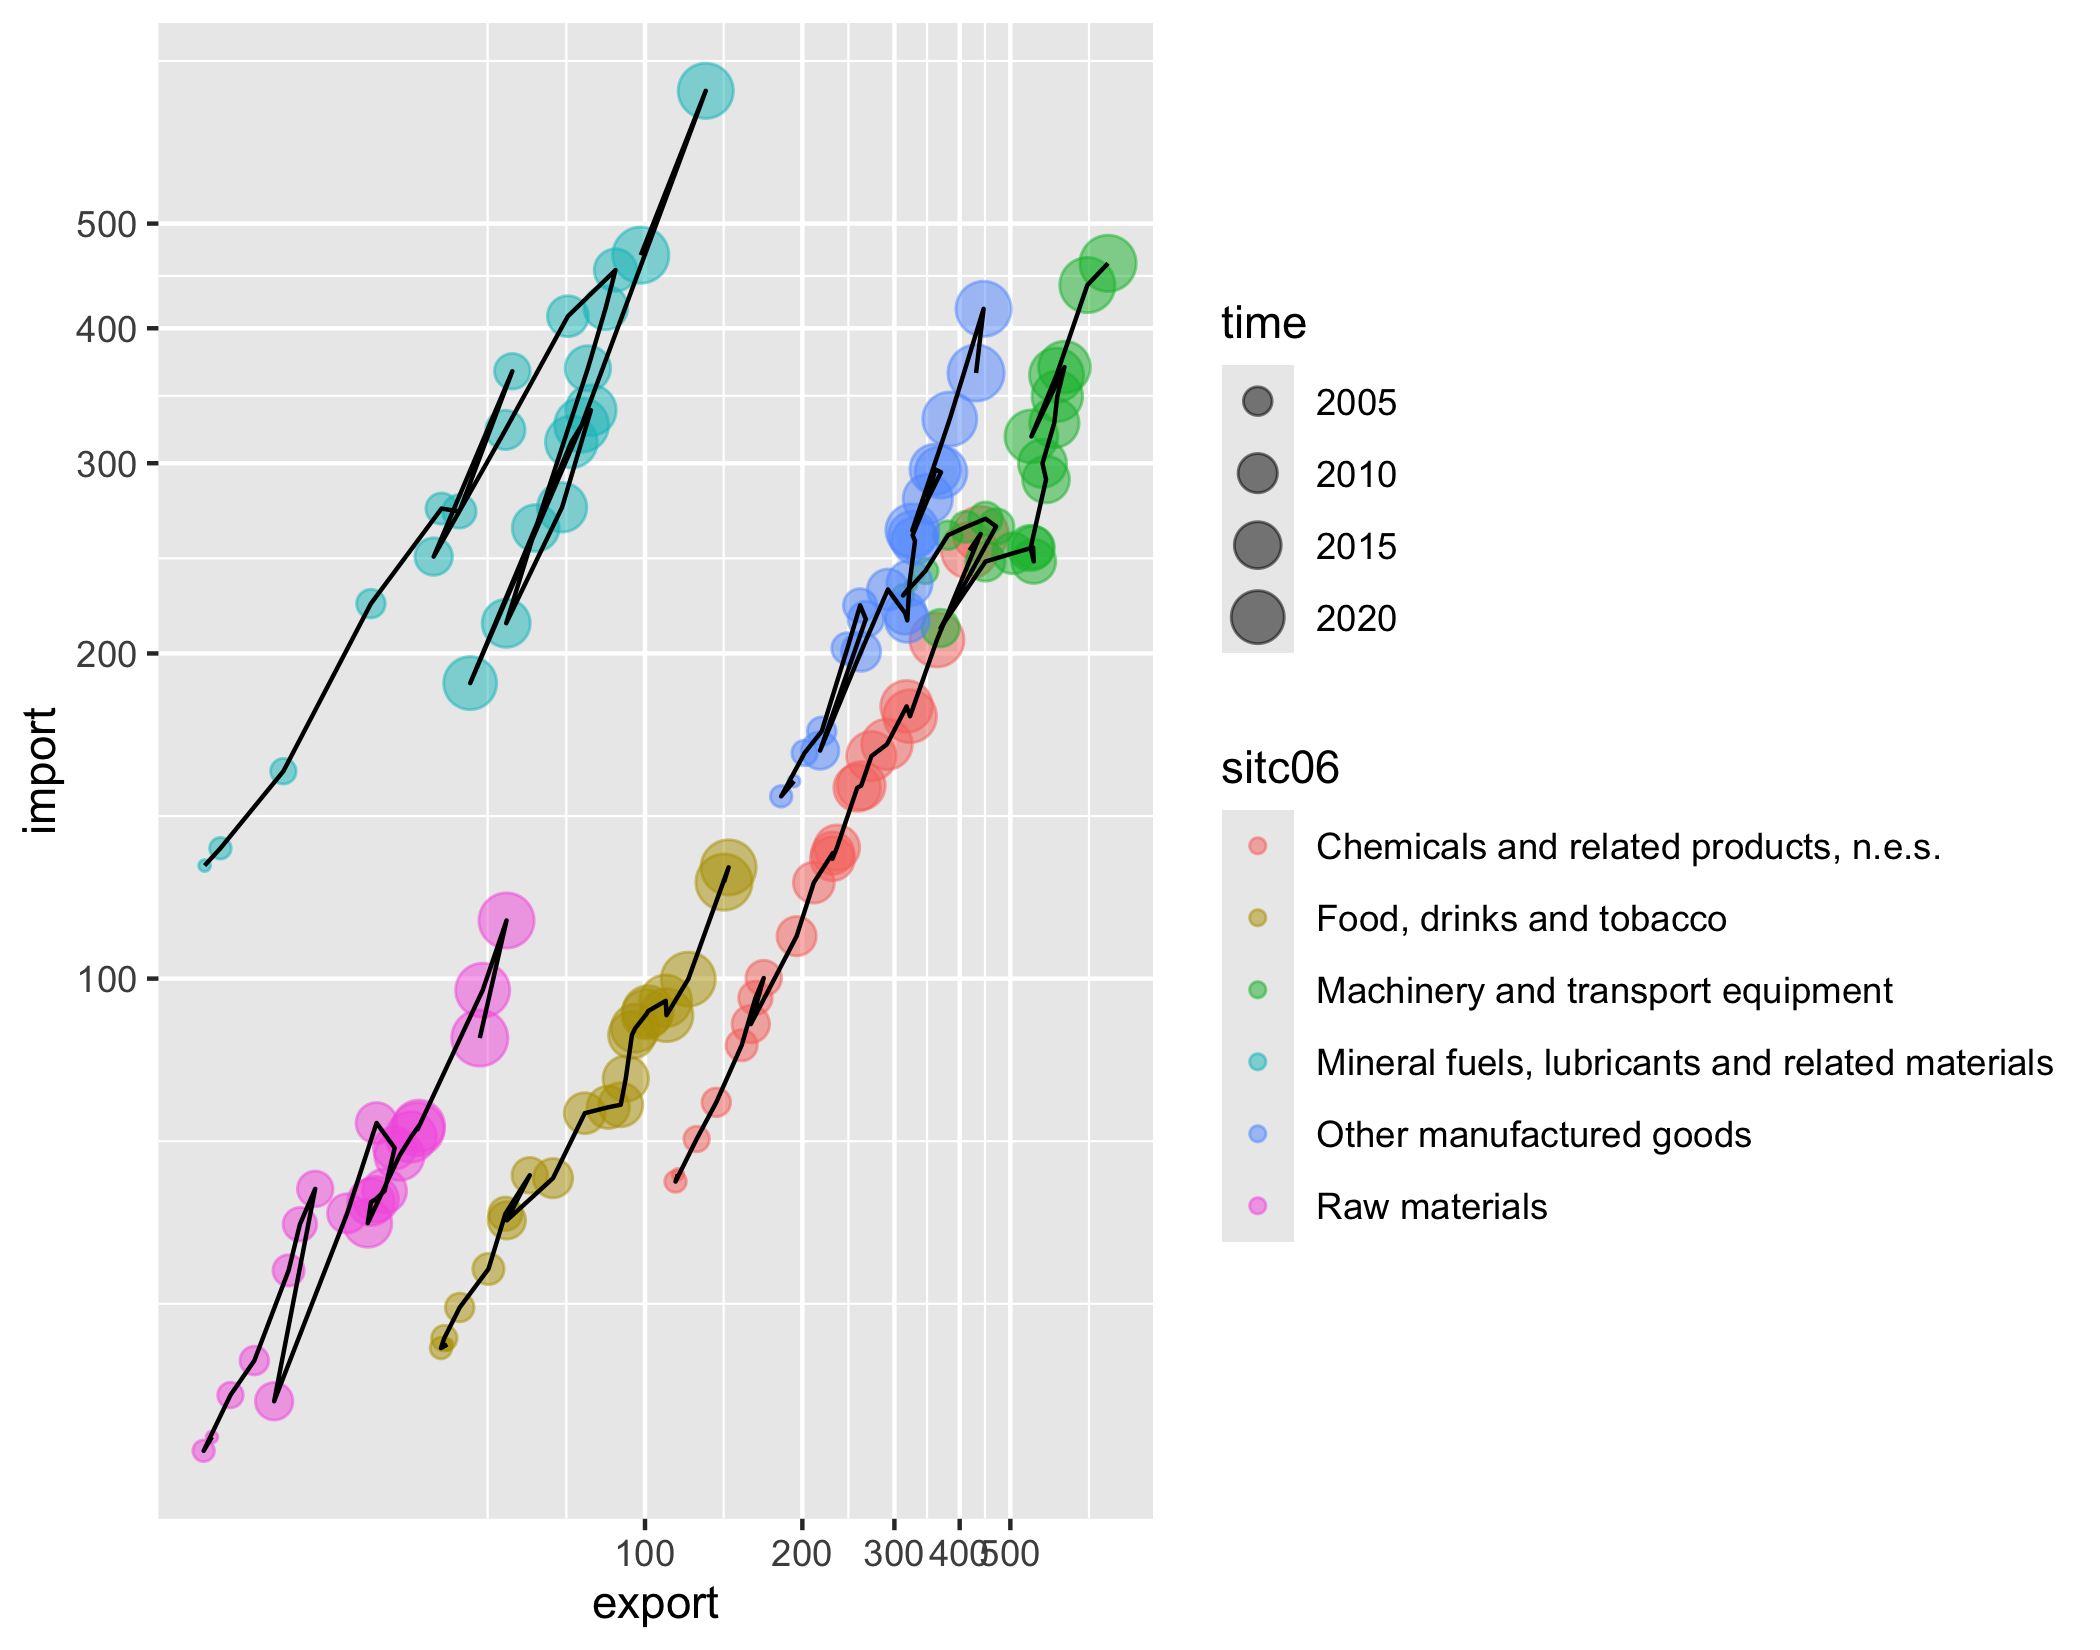<!-- --> ] --- ## Разметка осей .left-40[ Диапазоны по осям и выделение ``` r ggplot(trades_type) + geom_point(mapping = aes( x = export, y = import, color = sitc06, size = time ), alpha = 0.5) + geom_path(mapping = aes( x = export, y = import, group = sitc06) ) + lims(color = 'Food, drinks and tobacco') + xlim(0, 75000) + ylim(30000, 75000) ``` ] .right-60[ 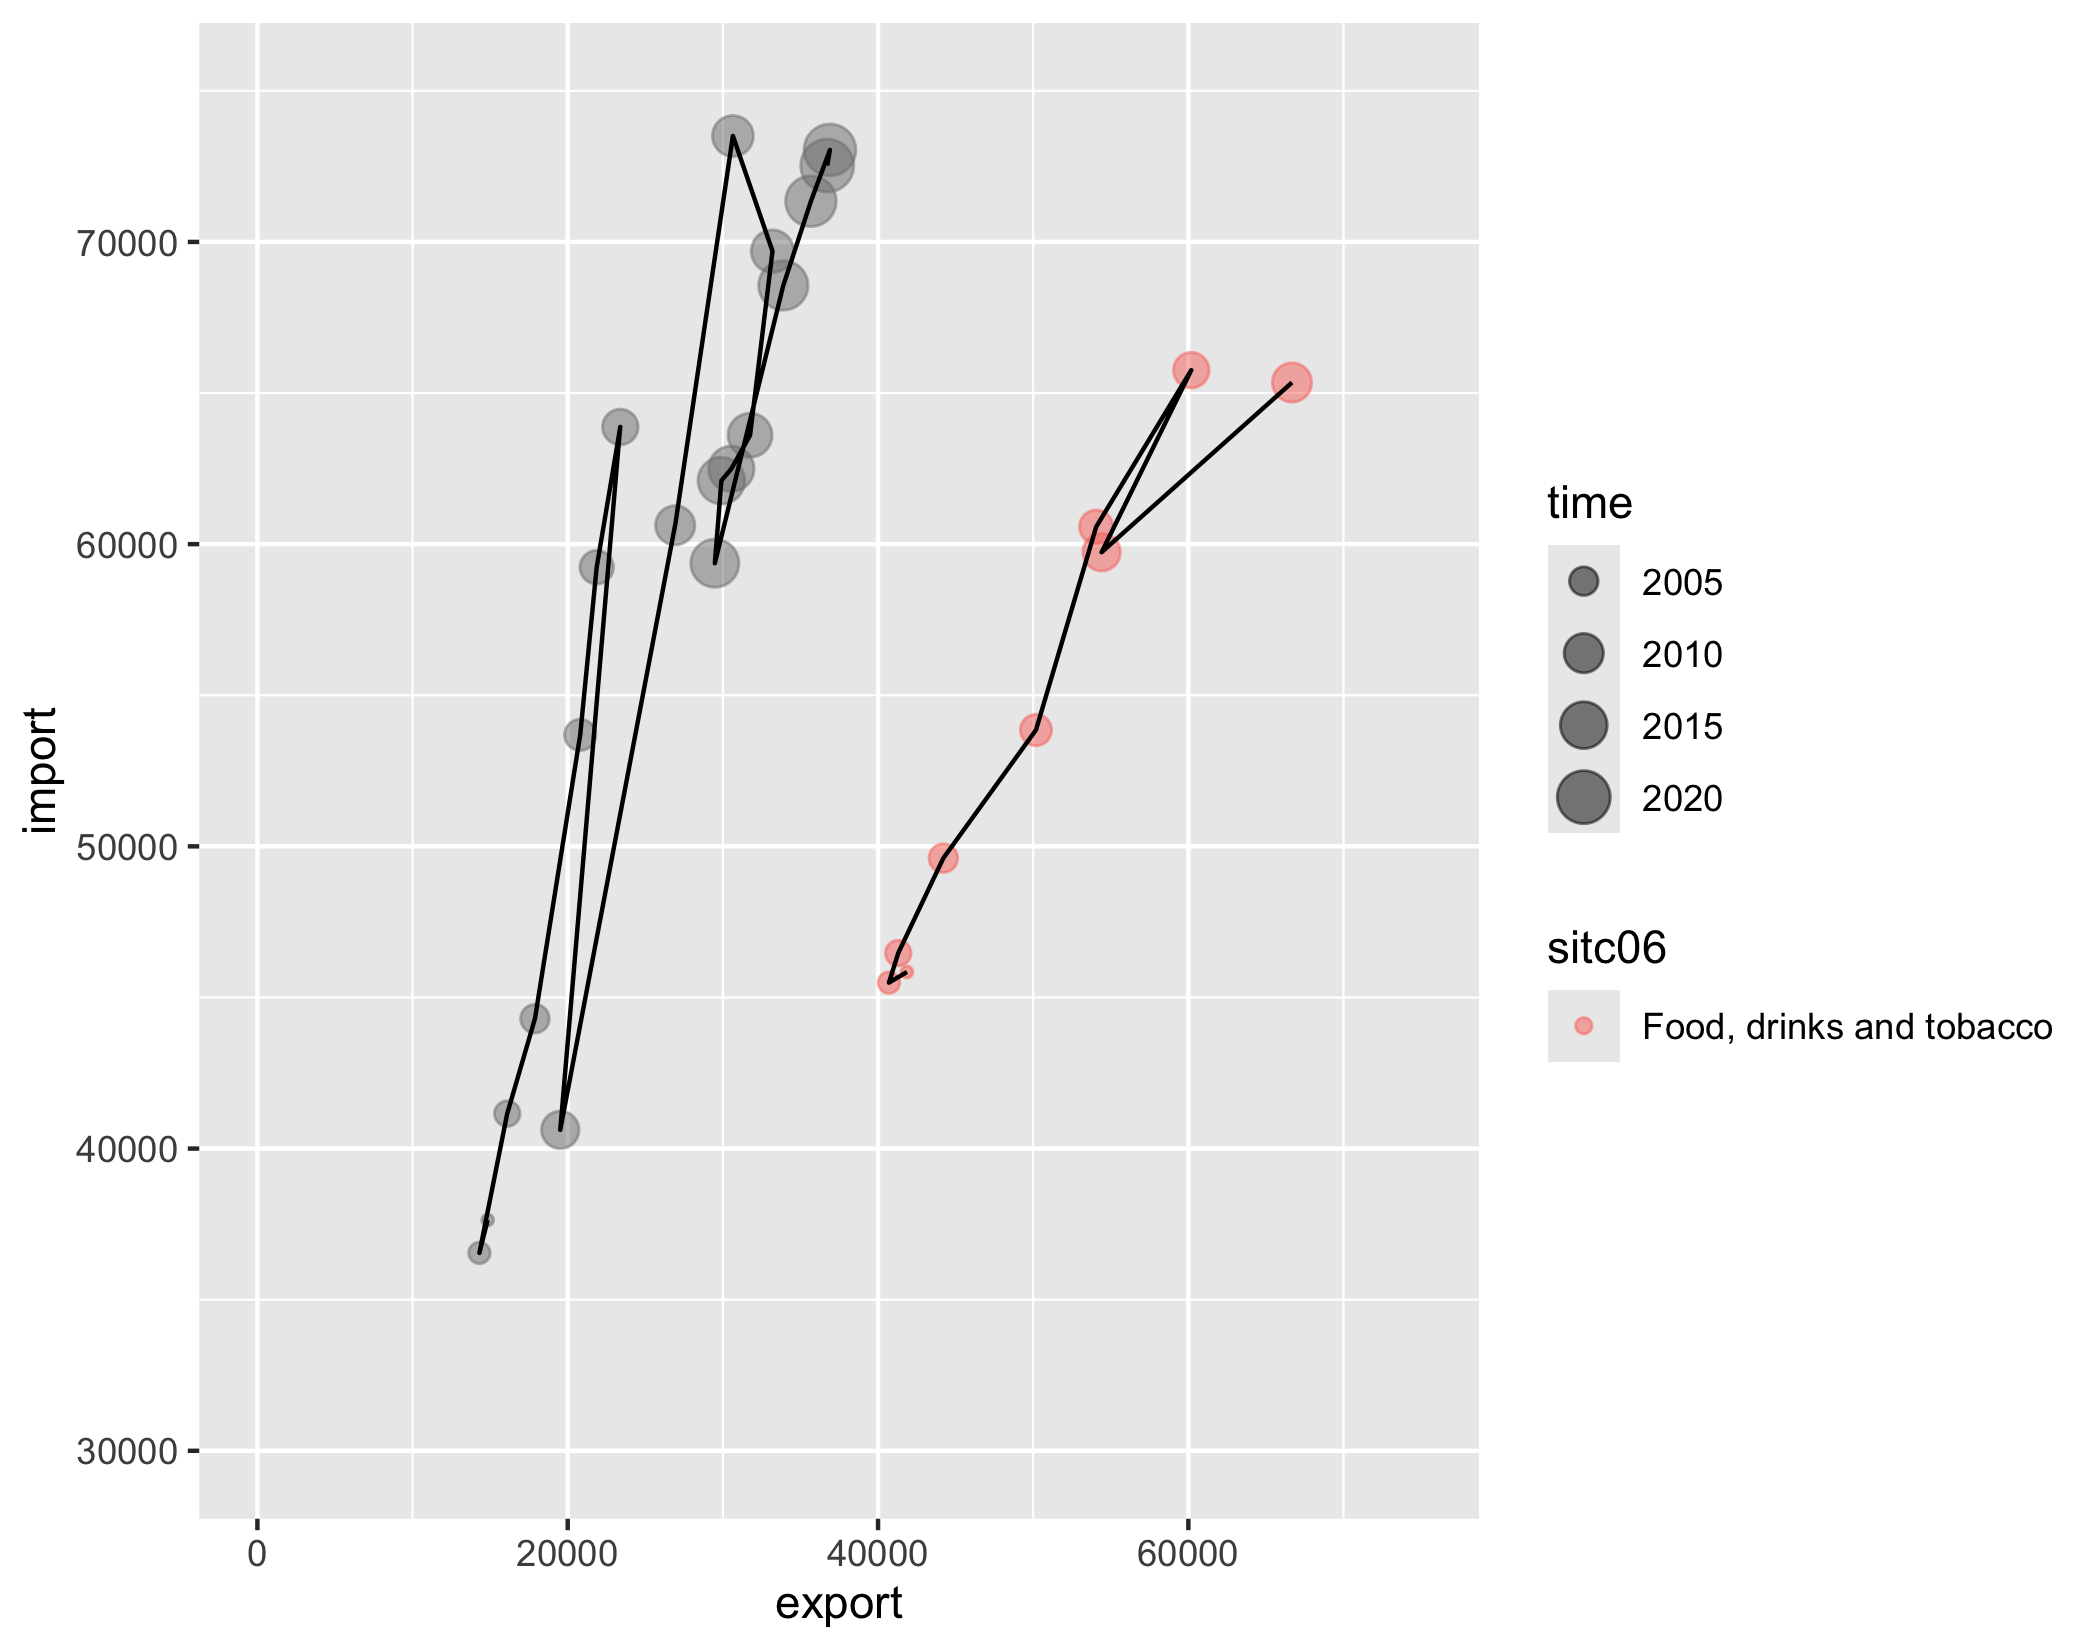<!-- --> ] --- ## Подписи и аннотации .pull-left[ Подписи: ``` r ggplot( data = trades_total, mapping = aes(x = time, y = export)) + geom_area(alpha = 0.5) + # полигон с прозрачностью 0,5 geom_line() + geom_point() + geom_text( # добавляем подписи aes(label = floor(export / 1000)), vjust = 0, nudge_y = 40000 ) ``` ] .pull-right[ 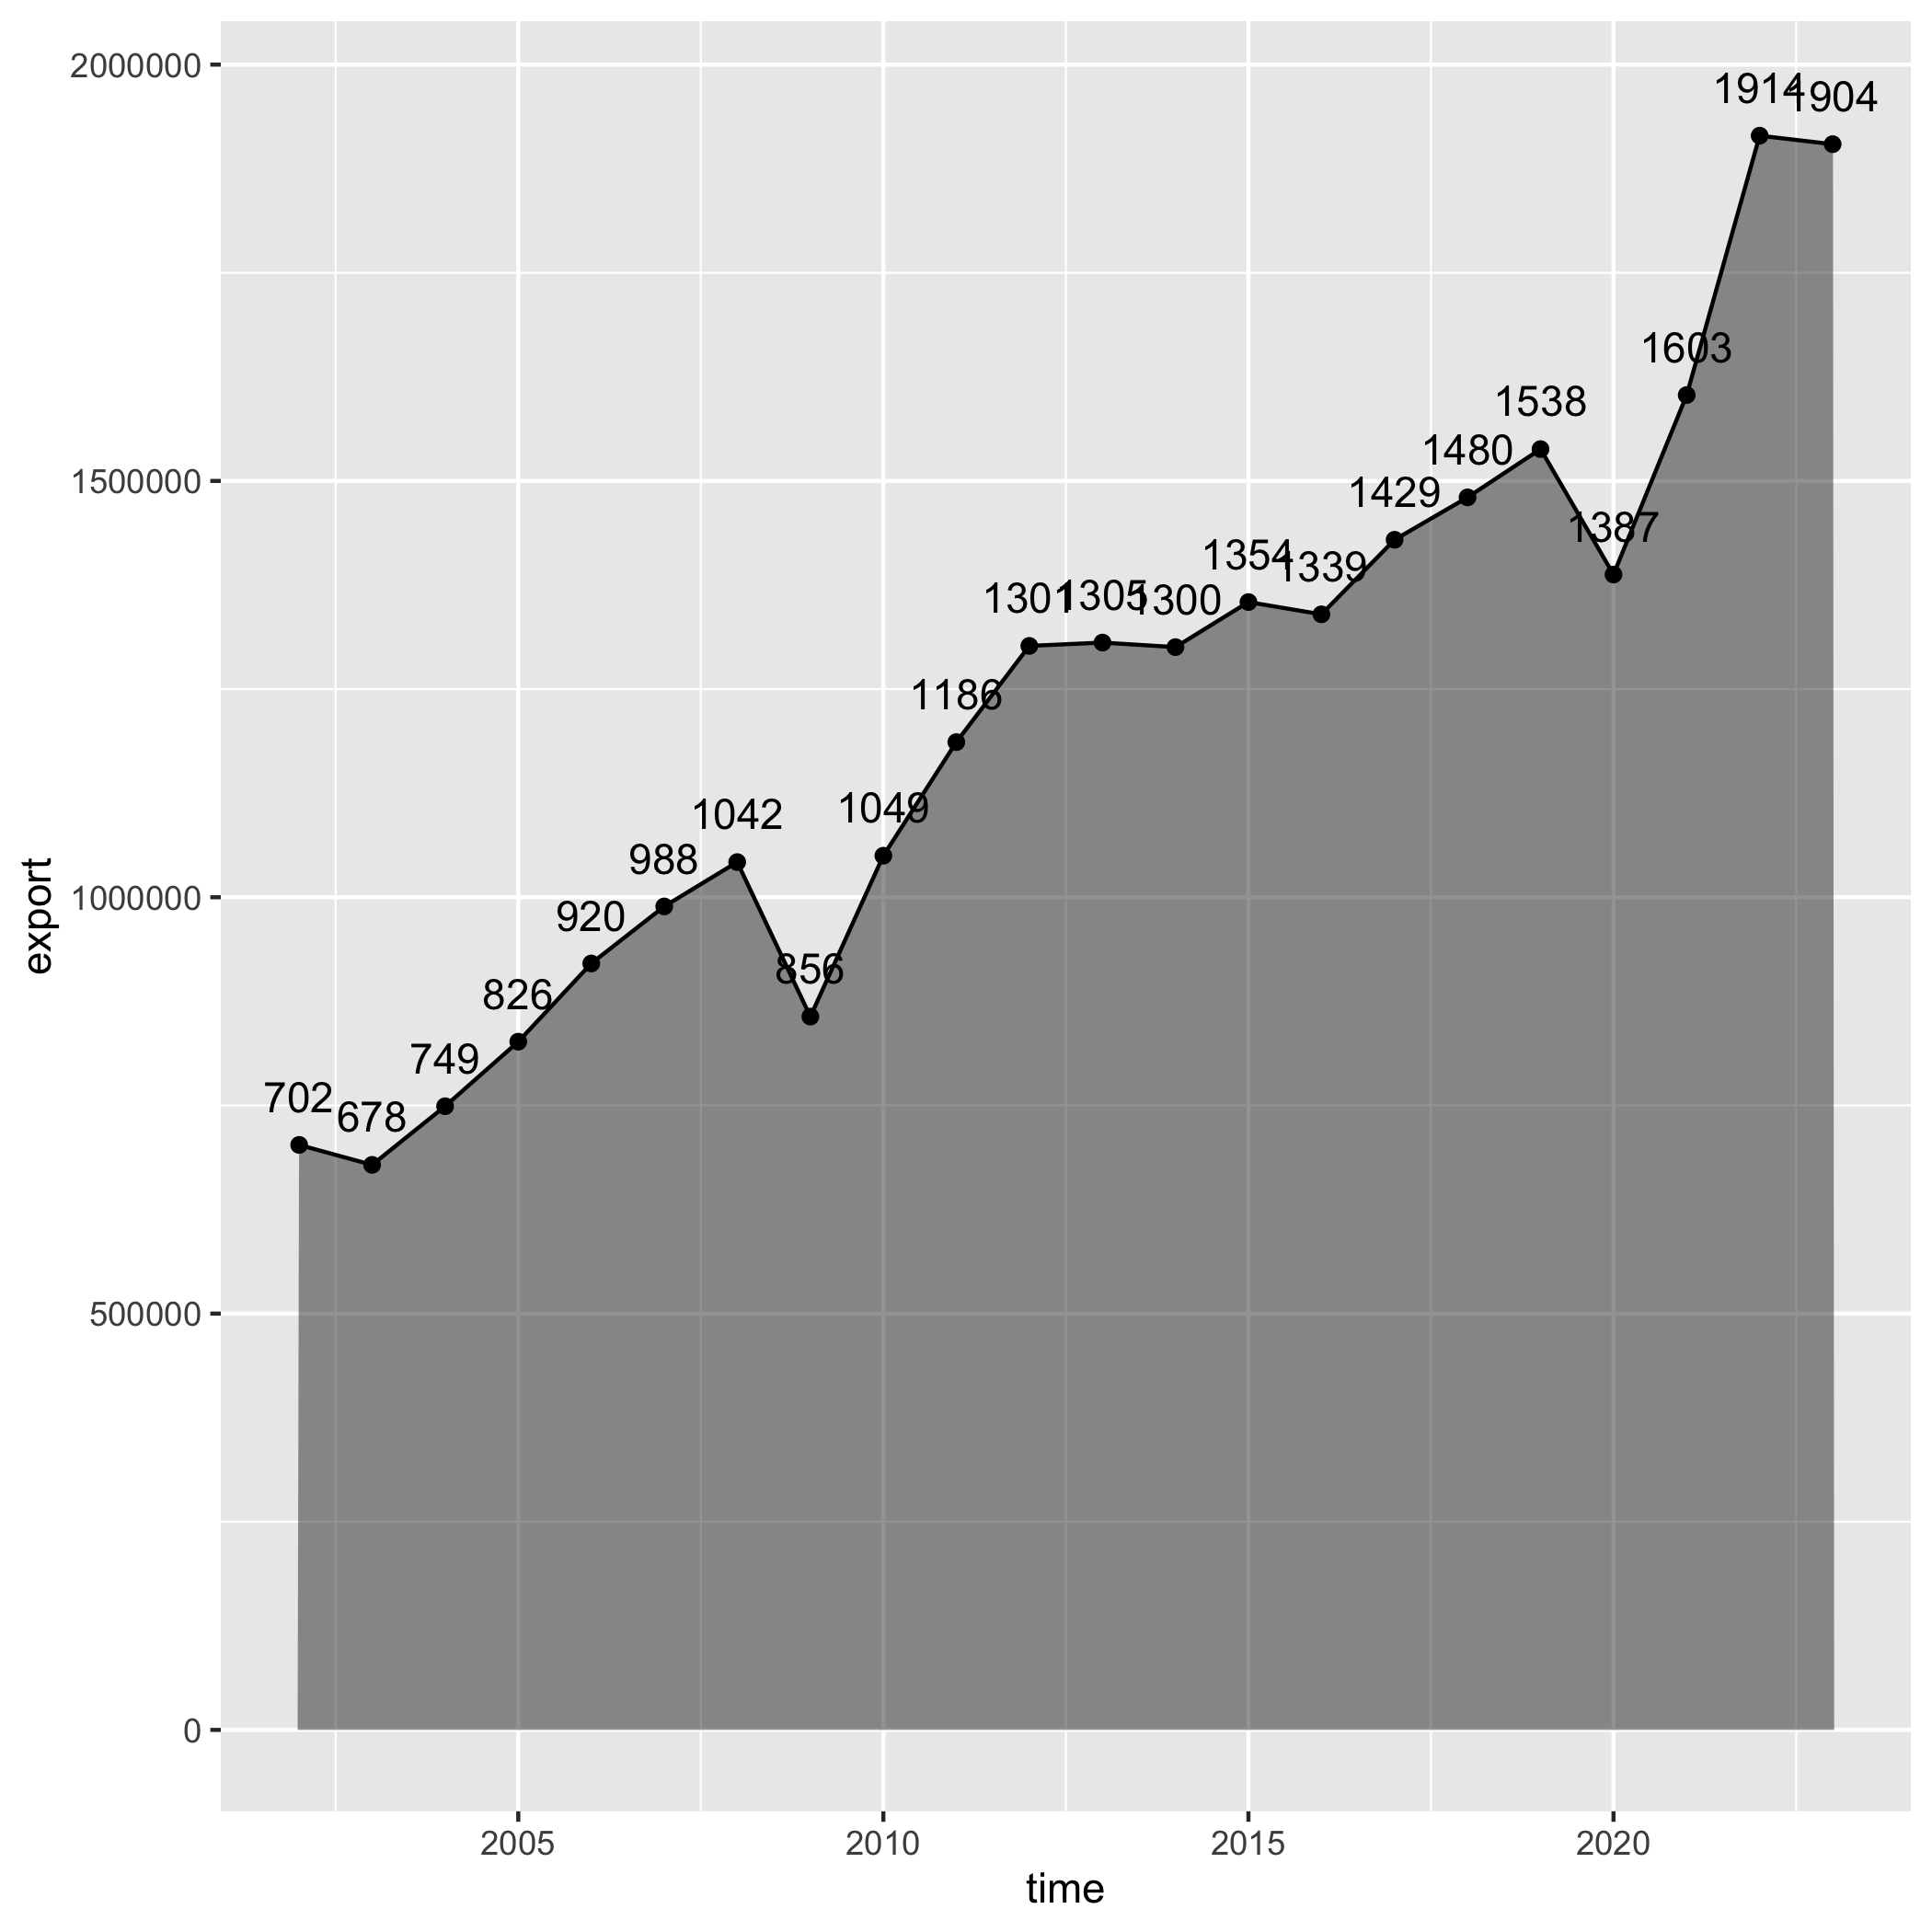<!-- --> ] --- ## Подписи и аннотации .left-40[ Подписи с фоновой плашкой: ``` r ggplot(df, mapping = aes(x = partner, y = export)) + geom_col(fill = 'plum4', color = 'black', size = 0.2) + coord_flip() + geom_label(aes(y = export / 2, label = floor(export / 1000))) # добавляем подписи ``` ] .right-60[ <!-- --> ] --- ## Подписи и аннотации .pull-left[ __Аннотации__ представляют собой объекты, размещаемые на графике вручную: ``` r ggplot(trades_total, mapping = aes(x = time, y = export)) + geom_area(alpha = 0.5) + # полигон с прозрачностью 0,5 geom_line() + geom_point() + geom_text(aes(label = floor(export / 1000)), vjust = 0, nudge_y = 40000) + annotate("text", x = as.Date('2009-01-01'), y = 550000, label = "Это провал", color = 'red') ``` ] .pull-right[ <!-- --> ] --- ## Подписи и аннотации .left-40[ Аннотирование регионов: ``` r ggplot(trades_type, mapping = aes( x = export, y = import, color = sitc06, size = time )) + annotate("rect", xmin = 100000, xmax = 500000, ymin = 50000, ymax = 300000, alpha = .2, color = 'black', size = 0.1) + geom_point(alpha = 0.5) + annotate("text", x = 350000, y = 80000, label = "Chemicals", color = 'coral') ``` ] .right-60[ <!-- --> ] --- ## Фасеты ``` r brks = c(0, 50, 100, 150, 200) trades |> filter(sitc06 == 'Machinery and transport equipment', time > as.Date('2014-01-01'), import > 30000) |> ggplot(mapping = aes(x = partner, y = import)) + geom_col() + scale_y_continuous(breaks = brks * 1e3, labels = brks) + ggtitle('Импорт продукции машиностроения (мдрд долл. США)', subtitle = 'Данные по ключевым партнерам') + coord_flip() + facet_wrap(~time) ``` --- ## Фасеты <!-- --> --- ## Темы .pull-left[ ``` r ggplot(data = trades_total, mapping = aes(x = time, y = export)) + geom_area(alpha = 0.5) + # полигон с прозрачностью 0,5 geom_line() + geom_point() + geom_text(aes(label = floor(export / 1000)), vjust = 0, nudge_y = 40000) + theme_bw() ``` ] .pull-right[ <!-- --> ]