class: center, middle, inverse, title-slide .title[ # Основы статистики в R ] .subtitle[ ## Визуализация и анализ географических данных на языке R ] .author[ ### Тимофей Самсонов ] .institute[ ### МГУ имени Ломоносова, Географический факультет ] .date[ ### 2024-10-15 ] --- ## Предварительные требования Используемые пакеты: ``` r library(tidyverse) library(googlesheets4) library(ggrepel) library(readxl) ``` Новые пакеты: __googlesheets4__ и __googledrive__ --- ## База данных Gapminder [__gapminder.org__](gapminder.org) <img src="img/gapminder1.png" width="60%" /> --- ## Ключ таблицы Google Sheets Ключ таблицы расположен в адресной строке между `/d/` и `/edit#`: <img src="img/gapminder_key.png" width="60%" /> --- ## Загрузка данных Gapminder через googlesheets4 В качестве примера возьмем данные по [__ВВП на душу населения__](https://www.gapminder.org/data/documentation/gd001/): ```r gdpdf = read_sheet('1cxtzRRN6ldjSGoDzFHkB8vqPavq1iOTMElGewQnmHgg') head(gdpdf) ## # A tibble: 6 × 256 ## `GDP per capita P… `1764` `1765` `1766` `1767` `1768` `1769` `1770` `1771` `1772` `1773` `1774` `1775` `1776` `1777` `1778` `1779` ## <chr> <dbl> <dbl> <dbl> <dbl> <dbl> <dbl> <dbl> <dbl> <dbl> <dbl> <dbl> <dbl> <dbl> <dbl> <dbl> <dbl> ## 1 Abkhazia NA NA NA NA NA NA NA NA NA NA NA NA NA NA NA NA ## 2 Afghanistan NA NA NA NA NA NA NA NA NA NA NA NA NA NA NA NA ## 3 Akrotiri and Dhek… NA NA NA NA NA NA NA NA NA NA NA NA NA NA NA NA ## 4 Albania NA NA NA NA NA NA NA NA NA NA NA NA NA NA NA NA ## 5 Algeria NA NA NA NA NA NA NA NA NA NA NA NA NA NA NA NA ## 6 American Samoa NA NA NA NA NA NA NA NA NA NA NA NA NA NA NA NA ## # … with 239 more variables: 1780 <dbl>, 1781 <dbl>, 1782 <dbl>, 1783 <dbl>, 1784 <dbl>, 1785 <dbl>, 1786 <dbl>, 1787 <dbl>, ## # 1788 <dbl>, 1789 <dbl>, 1790 <dbl>, 1791 <dbl>, 1792 <dbl>, 1793 <dbl>, 1794 <dbl>, 1795 <dbl>, 1796 <dbl>, 1797 <dbl>, ## # 1798 <dbl>, 1799 <dbl>, 1800 <dbl>, 1801 <dbl>, 1802 <dbl>, 1803 <dbl>, 1804 <dbl>, 1805 <dbl>, 1806 <dbl>, 1807 <dbl>, ## # 1808 <dbl>, 1809 <dbl>, 1810 <dbl>, 1811 <dbl>, 1812 <dbl>, 1813 <dbl>, 1814 <dbl>, 1815 <dbl>, 1816 <dbl>, 1817 <dbl>, ## # 1818 <dbl>, 1819 <dbl>, 1820 <dbl>, 1821 <dbl>, 1822 <dbl>, 1823 <dbl>, 1824 <dbl>, 1825 <dbl>, 1826 <dbl>, 1827 <dbl>, ## # 1828 <dbl>, 1829 <dbl>, 1830 <dbl>, 1831 <dbl>, 1832 <dbl>, 1833 <dbl>, 1834 <dbl>, 1835 <dbl>, 1836 <dbl>, 1837 <dbl>, ## # 1838 <dbl>, 1839 <dbl>, 1840 <dbl>, 1841 <dbl>, 1842 <dbl>, 1843 <dbl>, 1844 <dbl>, 1845 <dbl>, 1846 <dbl>, 1847 <dbl>, … ``` --- ## Загрузка данных Gapminder через googlesheets4 Аналогично рассмотрим показатель [__ожидаемой продолжительности жизни__](https://www.gapminder.org/data/documentation/gd004/): ```r lifedf = read_sheet('1H3nzTwbn8z4lJ5gJ_WfDgCeGEXK3PVGcNjQ_U5og8eo') head(lifedf) ## # A tibble: 6 × 218 ## `Life expectancy` `1800` `1801` `1802` `1803` `1804` `1805` `1806` `1807` `1808` `1809` `1810` `1811` `1812` `1813` `1814` `1815` ## <chr> <dbl> <dbl> <dbl> <dbl> <dbl> <dbl> <dbl> <dbl> <dbl> <dbl> <dbl> <dbl> <dbl> <dbl> <dbl> <dbl> ## 1 Abkhazia NA NA NA NA NA NA NA NA NA NA NA NA NA NA NA NA ## 2 Afghanistan 28.2 28.2 28.2 28.2 28.2 28.2 28.2 28.1 28.1 28.1 28.1 28.1 28.1 28.1 28.1 28.1 ## 3 Akrotiri and Dhek… NA NA NA NA NA NA NA NA NA NA NA NA NA NA NA NA ## 4 Albania 35.4 35.4 35.4 35.4 35.4 35.4 35.4 35.4 35.4 35.4 35.4 35.4 35.4 35.4 35.4 35.4 ## 5 Algeria 28.8 28.8 28.8 28.8 28.8 28.8 28.8 28.8 28.8 28.8 28.8 28.8 28.8 28.8 28.8 28.8 ## 6 American Samoa NA NA NA NA NA NA NA NA NA NA NA NA NA NA NA NA ## # … with 201 more variables: 1816 <dbl>, 1817 <dbl>, 1818 <dbl>, 1819 <dbl>, 1820 <dbl>, 1821 <dbl>, 1822 <dbl>, 1823 <dbl>, ## # 1824 <dbl>, 1825 <dbl>, 1826 <dbl>, 1827 <dbl>, 1828 <dbl>, 1829 <dbl>, 1830 <dbl>, 1831 <dbl>, 1832 <dbl>, 1833 <dbl>, ## # 1834 <dbl>, 1835 <dbl>, 1836 <dbl>, 1837 <dbl>, 1838 <dbl>, 1839 <dbl>, 1840 <dbl>, 1841 <dbl>, 1842 <dbl>, 1843 <dbl>, ## # 1844 <dbl>, 1845 <dbl>, 1846 <dbl>, 1847 <dbl>, 1848 <dbl>, 1849 <dbl>, 1850 <dbl>, 1851 <dbl>, 1852 <dbl>, 1853 <dbl>, ## # 1854 <dbl>, 1855 <dbl>, 1856 <dbl>, 1857 <dbl>, 1858 <dbl>, 1859 <dbl>, 1860 <dbl>, 1861 <dbl>, 1862 <dbl>, 1863 <dbl>, ## # 1864 <dbl>, 1865 <dbl>, 1866 <dbl>, 1867 <dbl>, 1868 <dbl>, 1869 <dbl>, 1870 <dbl>, 1871 <dbl>, 1872 <dbl>, 1873 <dbl>, ## # 1874 <dbl>, 1875 <dbl>, 1876 <dbl>, 1877 <dbl>, 1878 <dbl>, 1879 <dbl>, 1880 <dbl>, 1881 <dbl>, 1882 <dbl>, 1883 <dbl>, … ``` --- ## Загрузка данных Gapminder через googlesheets4 Также нам понадобятся данные [__численности населения__](): ```r popdf = read_sheet('1IbDM8z5XicMIXgr93FPwjgwoTTKMuyLfzU6cQrGZzH8') head(popdf) ## # A tibble: 6 × 82 ## `Total population` `1800` `1810` `1820` `1830` `1840` `1850` `1860` `1870` `1880` `1890` `1900` `1910` `1920` `1930` ## <chr> <dbl> <dbl> <dbl> <dbl> <dbl> <dbl> <dbl> <dbl> <dbl> <dbl> <dbl> <dbl> <dbl> <dbl> ## 1 Abkhazia NA NA NA NA NA NA NA NA NA NA NA NA NA NA ## 2 Afghanistan 3280000 3280000 3323519 3448982 3625022 3810047 3973968 4169690 4419695 4710171 5021241 5351413 5813814 6394908 ## 3 Akrotiri and Dhek… NA NA NA NA NA NA NA NA NA NA NA NA NA NA ## 4 Albania 410445 423591 438671 457234 478227 506889 552800 610036 672544 741688 819950 901122 963956 1015991 ## 5 Algeria 2503218 2595056 2713079 2880355 3082721 3299305 3536468 3811028 4143163 4525691 4946166 5404045 6063800 6876190 ## 6 American Samoa 8170 8156 8142 8128 8114 7958 7564 7057 6582 6139 5949 7047 8173 10081 ## # … with 67 more variables: 1940 <dbl>, 1950 <dbl>, 1951 <dbl>, 1952 <dbl>, 1953 <dbl>, 1954 <dbl>, 1955 <dbl>, 1956 <dbl>, ## # 1957 <dbl>, 1958 <dbl>, 1959 <dbl>, 1960 <dbl>, 1961 <dbl>, 1962 <dbl>, 1963 <dbl>, 1964 <dbl>, 1965 <dbl>, 1966 <dbl>, ## # 1967 <dbl>, 1968 <dbl>, 1969 <dbl>, 1970 <dbl>, 1971 <dbl>, 1972 <dbl>, 1973 <dbl>, 1974 <dbl>, 1975 <dbl>, 1976 <dbl>, ## # 1977 <dbl>, 1978 <dbl>, 1979 <dbl>, 1980 <dbl>, 1981 <dbl>, 1982 <dbl>, 1983 <dbl>, 1984 <dbl>, 1985 <dbl>, 1986 <dbl>, ## # 1987 <dbl>, 1988 <dbl>, 1989 <dbl>, 1990 <dbl>, 1991 <dbl>, 1992 <dbl>, 1993 <dbl>, 1994 <dbl>, 1995 <dbl>, 1996 <dbl>, ## # 1997 <dbl>, 1998 <dbl>, 1999 <dbl>, 2000 <dbl>, 2001 <dbl>, 2002 <dbl>, 2003 <dbl>, 2004 <dbl>, 2005 <dbl>, 2006 <dbl>, ## # 2007 <dbl>, 2008 <dbl>, 2009 <dbl>, 2010 <dbl>, 2011 <dbl>, 2012 <dbl>, 2013 <dbl>, 2014 <dbl>, 2015 <dbl> ``` --- ## Загрузка данных Gapminder через googlesheets4 И географические данные по [__странам__](https://www.gapminder.org/data/geo/): ```r countdf = read_sheet('1qHalit8sXC0R8oVXibc2wa2gY7bkwGzOybEMTWp-08o', 2) head(countdf) ## # A tibble: 6 × 13 ## geo name four_regions eight_regions six_regions members_oecd_g77 Latitude Longitude `UN member since` `World bank reg… ## <chr> <chr> <chr> <chr> <chr> <chr> <dbl> <dbl> <dttm> <chr> ## 1 aus Australia asia east_asia_pa… east_asia_… oecd -25 135 1945-11-01 00:00:00 East Asia & Pac… ## 2 brn Brunei asia east_asia_pa… east_asia_… g77 4.5 115. 1984-09-21 00:00:00 East Asia & Pac… ## 3 khm Cambodia asia east_asia_pa… east_asia_… g77 13 105 1955-12-14 00:00:00 East Asia & Pac… ## 4 chn China asia east_asia_pa… east_asia_… g77 35 105 1945-10-24 00:00:00 East Asia & Pac… ## 5 fji Fiji asia east_asia_pa… east_asia_… g77 -18 178 1970-10-13 00:00:00 East Asia & Pac… ## 6 hkg Hong Kong, China asia east_asia_pa… east_asia_… others 22.3 114. NA East Asia & Pac… ## # … with 3 more variables: World bank, 4 income groups 2017 <chr>, World bank, 3 income groups 2017 <chr>, UNHCR <chr> ``` Дальнейшие примеры статистического анализа будут основываться на этих данных. --- ## Оценка распределения Приведем выгруженные ранее данные ВВП к аккуратному виду, избавившись от множества столбцов с годом измерения. Сразу получим данные за 2015 год для анализа: ``` r gdpdf_tidy = gdpdf |> pivot_longer(cols = `1764`:`2018`, names_to = 'year', values_to = 'gdp', names_transform = list(year = as.integer)) |> rename(Country = 1) (gdpdf15 = filter(gdpdf_tidy, year == 2015)) ## # A tibble: 260 × 3 ## Country year gdp ## <chr> <int> <dbl> ## 1 Abkhazia 2015 NA ## 2 Afghanistan 2015 1418. ## 3 Akrotiri and Dhekelia 2015 NA ## 4 Albania 2015 7343. ## 5 Algeria 2015 6797. ## 6 American Samoa 2015 NA ## 7 Andorra 2015 NA ## 8 Angola 2015 6512. ## 9 Anguilla 2015 NA ## 10 Antigua and Barbuda 2015 14884. ## # ℹ 250 more rows ``` --- ## Гистограмма распределения .pull-left[ Строится через `geom_histogram()`: ``` r ggplot(gdpdf15, aes(x = gdp)) + geom_histogram() ``` <!-- --> ] .pull-right[ Ширина кармана через `binwidth`: .code-small[ ``` r ggplot(gdpdf15, aes(x = gdp)) + geom_histogram( binwidth = 5000, size = 0.2, color = 'black', fill = 'steelblue' ) ``` <!-- --> ] ] --- ## Гистограмма распределения .pull-left[ Данные по продолжительности жизни: ``` r lifedf_tidy = lifedf |> pivot_longer( cols = `1800`:`2016`, names_to = 'year', values_to = 'lifexp', names_transform = list( year = as.integer ) ) |> rename(Country = 1) lifedf15 = filter(lifedf_tidy, year == 2015) ``` ] .pull-right[ .code-small[ ``` r ggplot(lifedf15, aes(x = lifexp)) + geom_histogram( binwidth = 2, color = 'black', fill = 'olivedrab', size = 0.2 ) ``` <!-- --> ] ] --- ## Плотность распределения Строится через `geom_density()`: .pull-left[ ``` r ggplot(gdpdf15, aes(x = gdp)) + geom_density(color = 'black', fill = 'steelblue', alpha = 0.5) ``` <!-- --> ] .pull-right[ ``` r ggplot(lifedf15, aes(x = lifexp)) + geom_density(color = 'black', fill = 'olivedrab', alpha = 0.5) ``` <!-- --> ] --- ## Плотность распределения Для комбинации с гистограммой нужно `y = stat(density)`: .pull-left[ .code-small[ ``` r ggplot(gdpdf15, aes(x = gdp)) + geom_histogram(aes(y = stat(density)), fill = 'grey', color = 'black', size = 0.1) + geom_density(color = 'black', fill = 'steelblue', alpha = 0.5) ``` <!-- --> ] ] .pull-right[ .code-small[ ``` r ggplot(lifedf15, aes(x = lifexp)) + geom_histogram(aes(y = stat(density)), fill = 'grey', color = 'black', size = 0.1) + geom_density(color = 'black', fill = 'olivedrab', alpha = 0.5) ``` <!-- --> ] ] --- ## Взвешенные данные Присоединим данные по населению: .pull-left[ ```r popdf_tidy = popdf |> # численность населения pivot_longer( cols = `1800`:`2015`, names_to = 'year', values_to = 'pop', names_transform = list( year = as.integer ) ) |> rename(Country = 1) tab = gdpdf_tidy |> inner_join(lifedf_tidy) |> inner_join(popdf_tidy) ``` ] .pull-right[ ``` r (tab15 = tab |> filter(year == 2015) |> drop_na()) ## # A tibble: 172 × 5 ## Country year gdp lifexp pop ## <chr> <int> <dbl> <dbl> <dbl> ## 1 Afghanistan 2015 1418. 53.8 32526562 ## 2 Albania 2015 7343. 78 2896679 ## 3 Algeria 2015 6797. 76.4 39666519 ## 4 Angola 2015 6512. 59.6 25021974 ## 5 Antigua and Barbuda 2015 14884. 76.4 91818 ## 6 Argentina 2015 16640. 76.5 43416755 ## 7 Armenia 2015 5561. 74.7 3017712 ## 8 Australia 2015 38085. 82.3 23968973 ## 9 Austria 2015 37811. 81.3 8544586 ## 10 Azerbaijan 2015 10475. 72.9 9753968 ## # ℹ 162 more rows ``` ] --- ## Взвешенные данные Теперь мы можем произвести взвешенную оценку плотности распределения: .pull-left[ .code-small[ ``` r ggplot(tab15, aes(x = gdp, y = stat(density), weight = pop/sum(pop))) + geom_histogram(binwidth = 5000, fill = 'grey', color = 'black', size = 0.1) + geom_density(color = 'black', fill = 'steelblue', alpha = 0.5) ``` <!-- --> ] ] .pull-right[ .code-small[ ``` r ggplot(tab15, aes(x = lifexp, y = stat(density), weight = pop/sum(pop))) + geom_histogram(binwidth = 2.5, fill = 'grey', color = 'black', size = 0.1) + geom_density(color = 'black', fill = 'olivedrab', alpha = 0.5) ``` <!-- --> ] ] --- ## Комбинация распределений Для комбинации по цвету можно задать `fill ` в эстетике: .code-small[ ``` r tab85 = tab |> filter(year %in% c(1965, 2015)) |> drop_na() ``` ] .pull-left[ .code-small[ ``` r ggplot(tab85, aes(x = gdp, fill = factor(year), weight = pop/sum(pop))) + geom_density(alpha = 0.5) ``` <!-- --> ] ] .pull-right[ .code-small[ ``` r ggplot(tab85, aes(x = lifexp, fill = factor(year), weight = pop/sum(pop))) + geom_density(alpha = 0.5) ``` <!-- --> ] ] --- ## Описательные статистики Присоединим данные по странам к исходной таблице: ```r countries = countdf |> select(Country = name, Region = eight_regions) %>% mutate(Country = factor(Country, levels = Country[order(.$Region)])) (tabreg = tab |> left_join(countries) |> filter(year == 2015) |> drop_na()) ## # A tibble: 172 × 6 ## Country year gdp lifexp pop Region ## <chr> <int> <dbl> <dbl> <dbl> <chr> ## 1 Afghanistan 2015 1418. 53.8 32526562 asia_west ## 2 Albania 2015 7343. 78 2896679 europe_east ## 3 Algeria 2015 6797. 76.4 39666519 africa_north ## 4 Angola 2015 6512. 59.6 25021974 africa_sub_saharan ## 5 Antigua and Barbuda 2015 14884. 76.4 91818 america_north ## 6 Argentina 2015 16640. 76.5 43416755 america_south ## 7 Armenia 2015 5561. 74.7 3017712 europe_east ## 8 Australia 2015 38085. 82.3 23968973 east_asia_pacific ## 9 Austria 2015 37811. 81.3 8544586 europe_west ## 10 Azerbaijan 2015 10475. 72.9 9753968 europe_east ## # … with 162 more rows ``` --- ## Ящики с усами (boxplot) .pull-left[ ``` r ggplot(tabreg, aes(x = Region, y = gdp)) + geom_boxplot() + coord_flip() ``` <!-- --> ] .pull-right[ ``` r ggplot(tabreg, aes(x = Region, y = lifexp)) + geom_boxplot() + coord_flip() ``` <!-- --> ] --- ## Агрегированные статистики ``` r (tabreg |> group_by(Region) |> summarise(gdp_mean = mean(gdp), gdp_sd = sd(gdp), lifexp_mean = mean(lifexp), lifexp_sd = sd(lifexp))) ## # A tibble: 8 × 5 ## Region gdp_mean gdp_sd lifexp_mean lifexp_sd ## <chr> <dbl> <dbl> <dbl> <dbl> ## 1 africa_north 6897. 3386. 73 4.97 ## 2 africa_sub_saharan 3583. 4553. 62.3 5.31 ## 3 america_north 13835. 11451. 74.9 4.00 ## 4 america_south 10350. 4277. 75.1 3.50 ## 5 asia_west 16374. 20957. 73.7 6.51 ## 6 east_asia_pacific 14062. 16634. 72.4 6.68 ## 7 europe_east 13634. 7030. 75.9 2.86 ## 8 europe_west 33571. 11104. 81.5 1.24 ``` --- ## Тест Стьюдента Проверка на равенство средних .code-small[ ``` r t.test(tabreg |> dplyr::filter(Region == 'africa_sub_saharan') |> pull(gdp), tabreg |> dplyr::filter(Region == 'europe_west') |> pull(gdp)) ## ## Welch Two Sample t-test ## ## data: pull(dplyr::filter(tabreg, Region == "africa_sub_saharan"), gdp) and pull(dplyr::filter(tabreg, Region == "europe_west"), gdp) ## t = -11.384, df = 20.547, p-value = 2.487e-10 ## alternative hypothesis: true difference in means is not equal to 0 ## 95 percent confidence interval: ## -35473.63 -24502.15 ## sample estimates: ## mean of x mean of y ## 3583.326 33571.214 ``` ] --- ## Тест Стьюдента Проверка на равенство средних .code-small[ ``` r t.test(tabreg |> dplyr::filter(Region == 'africa_sub_saharan') |> pull(lifexp), tabreg |> dplyr::filter(Region == 'europe_west') |> pull(lifexp)) ## ## Welch Two Sample t-test ## ## data: pull(dplyr::filter(tabreg, Region == "africa_sub_saharan"), lifexp) and pull(dplyr::filter(tabreg, Region == "europe_west"), lifexp) ## t = -23.037, df = 55.262, p-value < 2.2e-16 ## alternative hypothesis: true difference in means is not equal to 0 ## 95 percent confidence interval: ## -20.87392 -17.53317 ## sample estimates: ## mean of x mean of y ## 62.25435 81.45789 ``` ] --- ## Тест Стьюдента Проверка на равенство средних .code-small[ ``` r t.test(tabreg |> dplyr::filter(Region == 'america_north') |> pull(gdp), tabreg |> dplyr::filter(Region == 'america_south') |> pull(gdp)) ## ## Welch Two Sample t-test ## ## data: pull(dplyr::filter(tabreg, Region == "america_north"), gdp) and pull(dplyr::filter(tabreg, Region == "america_south"), gdp) ## t = 1.1742, df = 23.283, p-value = 0.2522 ## alternative hypothesis: true difference in means is not equal to 0 ## 95 percent confidence interval: ## -2650.736 9620.806 ## sample estimates: ## mean of x mean of y ## 13834.72 10349.69 ``` ] --- ## Тест Стьюдента Проверка на равенство средних .code-small[ ``` r t.test(tabreg |> dplyr::filter(Region == 'america_north') |> pull(lifexp), tabreg |> dplyr::filter(Region == 'america_south') |> pull(lifexp)) ## ## Welch Two Sample t-test ## ## data: pull(dplyr::filter(tabreg, Region == "america_north"), lifexp) and pull(dplyr::filter(tabreg, Region == "america_south"), lifexp) ## t = -0.20306, df = 25.802, p-value = 0.8407 ## alternative hypothesis: true difference in means is not equal to 0 ## 95 percent confidence interval: ## -3.121651 2.560540 ## sample estimates: ## mean of x mean of y ## 74.86111 75.14167 ``` ] --- ## Тест Фишера Проверка на равенство дисперсий: .code-small[ ``` r var.test(tabreg |> dplyr::filter(Region == 'europe_east') |> pull(gdp), tabreg |> dplyr::filter(Region == 'europe_west') |> pull(gdp)) ## ## F test to compare two variances ## ## data: pull(dplyr::filter(tabreg, Region == "europe_east"), gdp) and pull(dplyr::filter(tabreg, Region == "europe_west"), gdp) ## F = 0.40087, num df = 22, denom df = 18, p-value = 0.0434 ## alternative hypothesis: true ratio of variances is not equal to 1 ## 95 percent confidence interval: ## 0.1585416 0.9726112 ## sample estimates: ## ratio of variances ## 0.4008741 ``` ] --- ## Тест Фишера Проверка на равенство дисперсий: .code-small[ ``` r var.test(tabreg |> dplyr::filter(Region == 'europe_east') |> pull(lifexp), tabreg |> dplyr::filter(Region == 'europe_west') |> pull(lifexp)) ## ## F test to compare two variances ## ## data: pull(dplyr::filter(tabreg, Region == "europe_east"), lifexp) and pull(dplyr::filter(tabreg, Region == "europe_west"), lifexp) ## F = 5.3246, num df = 22, denom df = 18, p-value = 0.0006859 ## alternative hypothesis: true ratio of variances is not equal to 1 ## 95 percent confidence interval: ## 2.105831 12.918723 ## sample estimates: ## ratio of variances ## 5.324617 ``` ] --- ## Диаграмма рассеяния .pull-left[ ``` r ggplot(tabreg, aes(gdp, lifexp)) + geom_point() ``` ] .pull-left[ 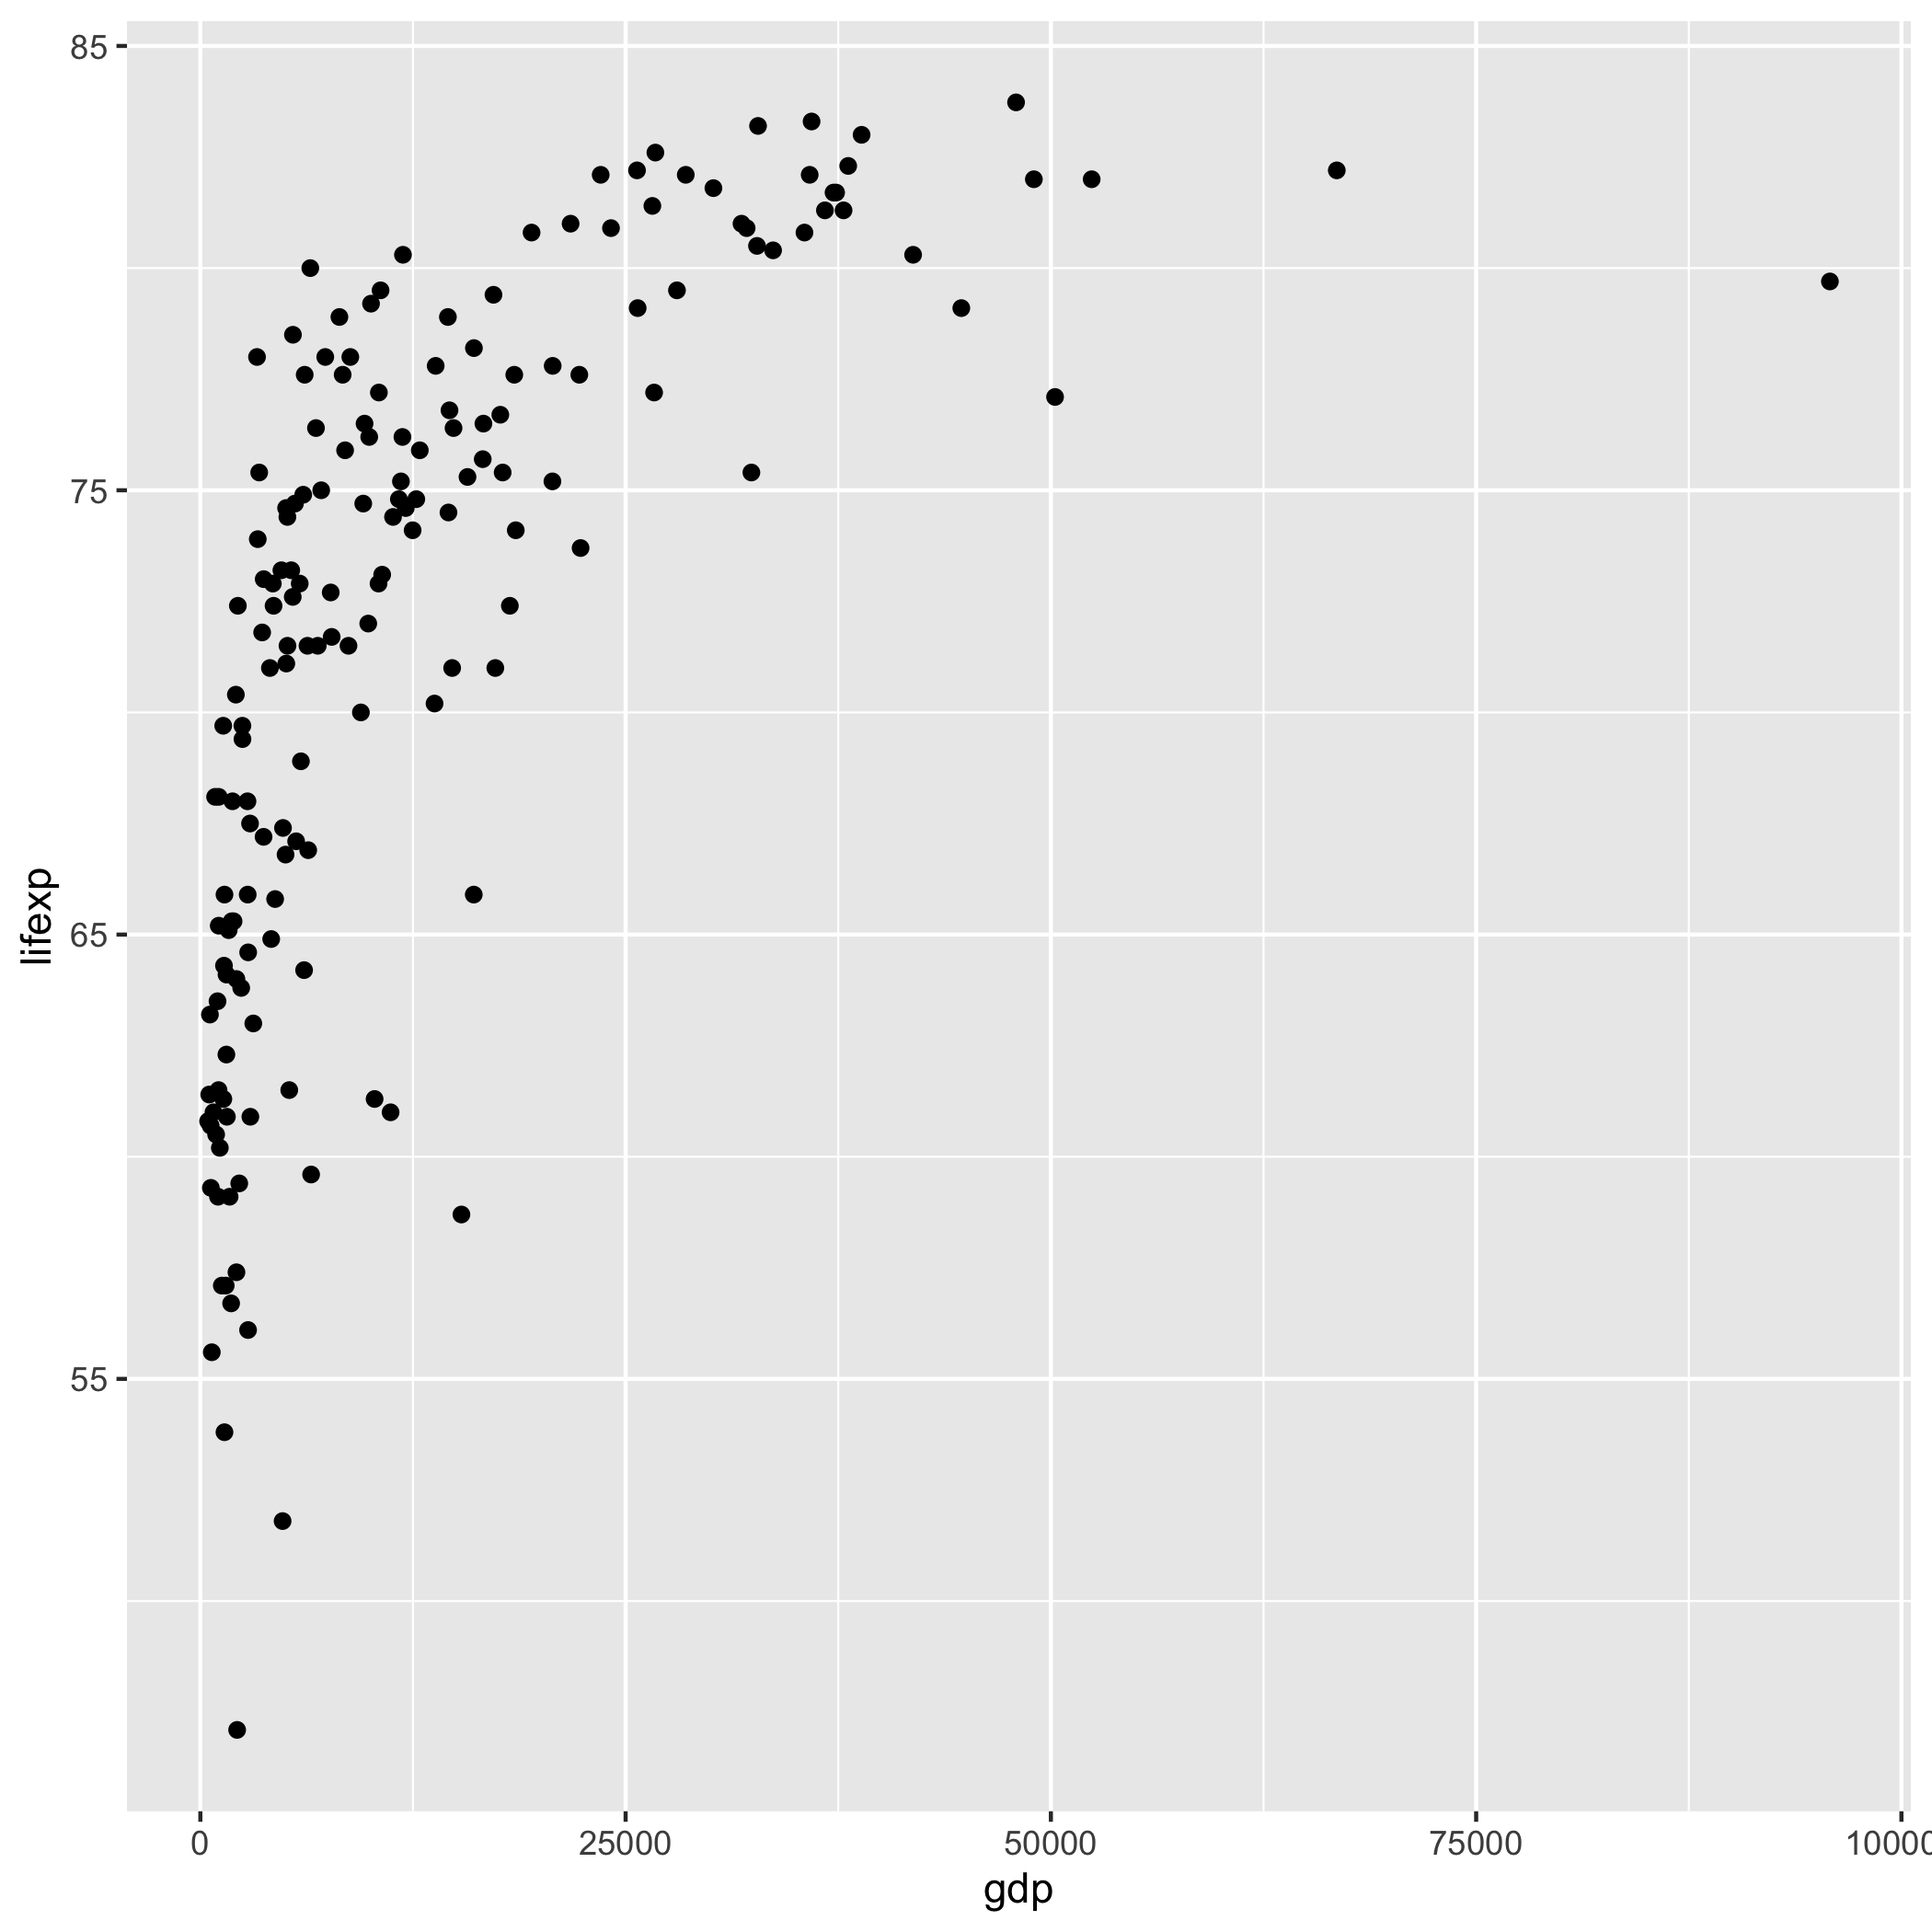<!-- --> ] --- ## Диаграмма рассеяния .pull-left[ ``` r options(scipen = 999) ggplot(tabreg, aes(gdp, lifexp)) + geom_point() + scale_x_log10() ``` ] .pull-right[ 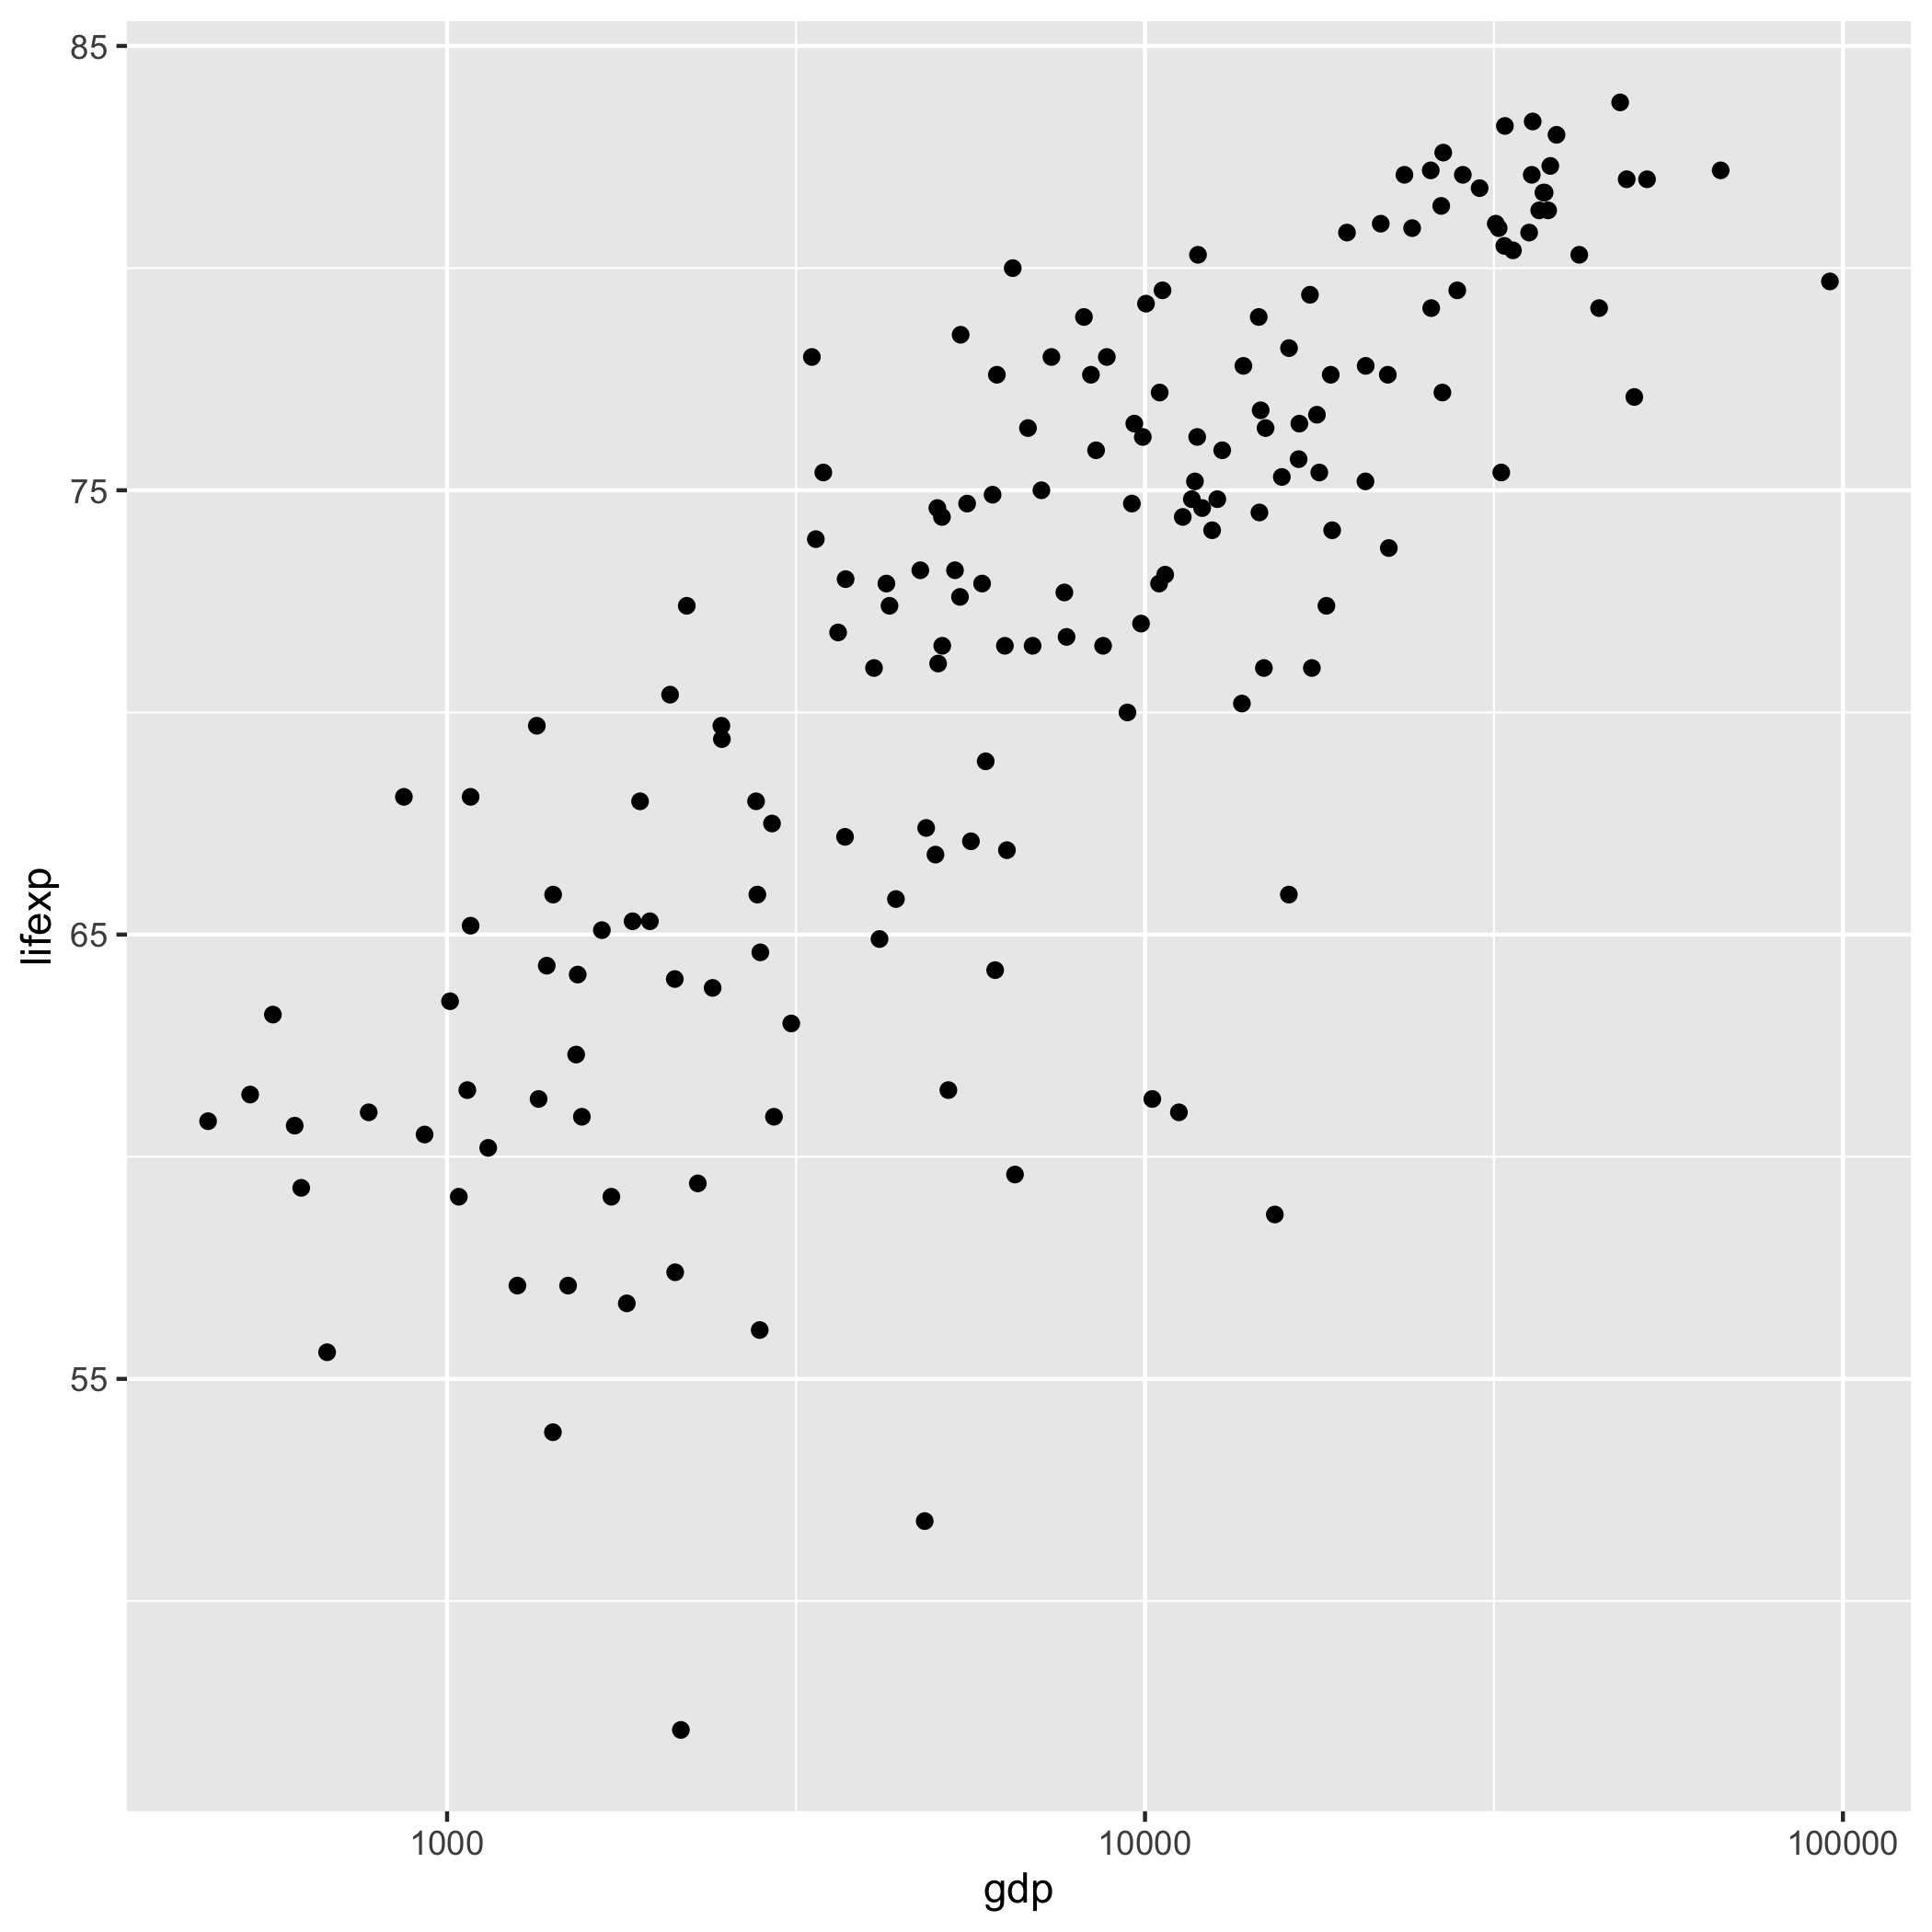<!-- --> ] --- ## Диаграмма рассеяния .pull-left[ ``` r options(scipen = 999) ggplot(tabreg, aes(gdp, lifexp, size = pop, color = Region)) + geom_point(alpha = 0.5) + scale_x_log10() + theme_bw() ``` ] .pull-right[ 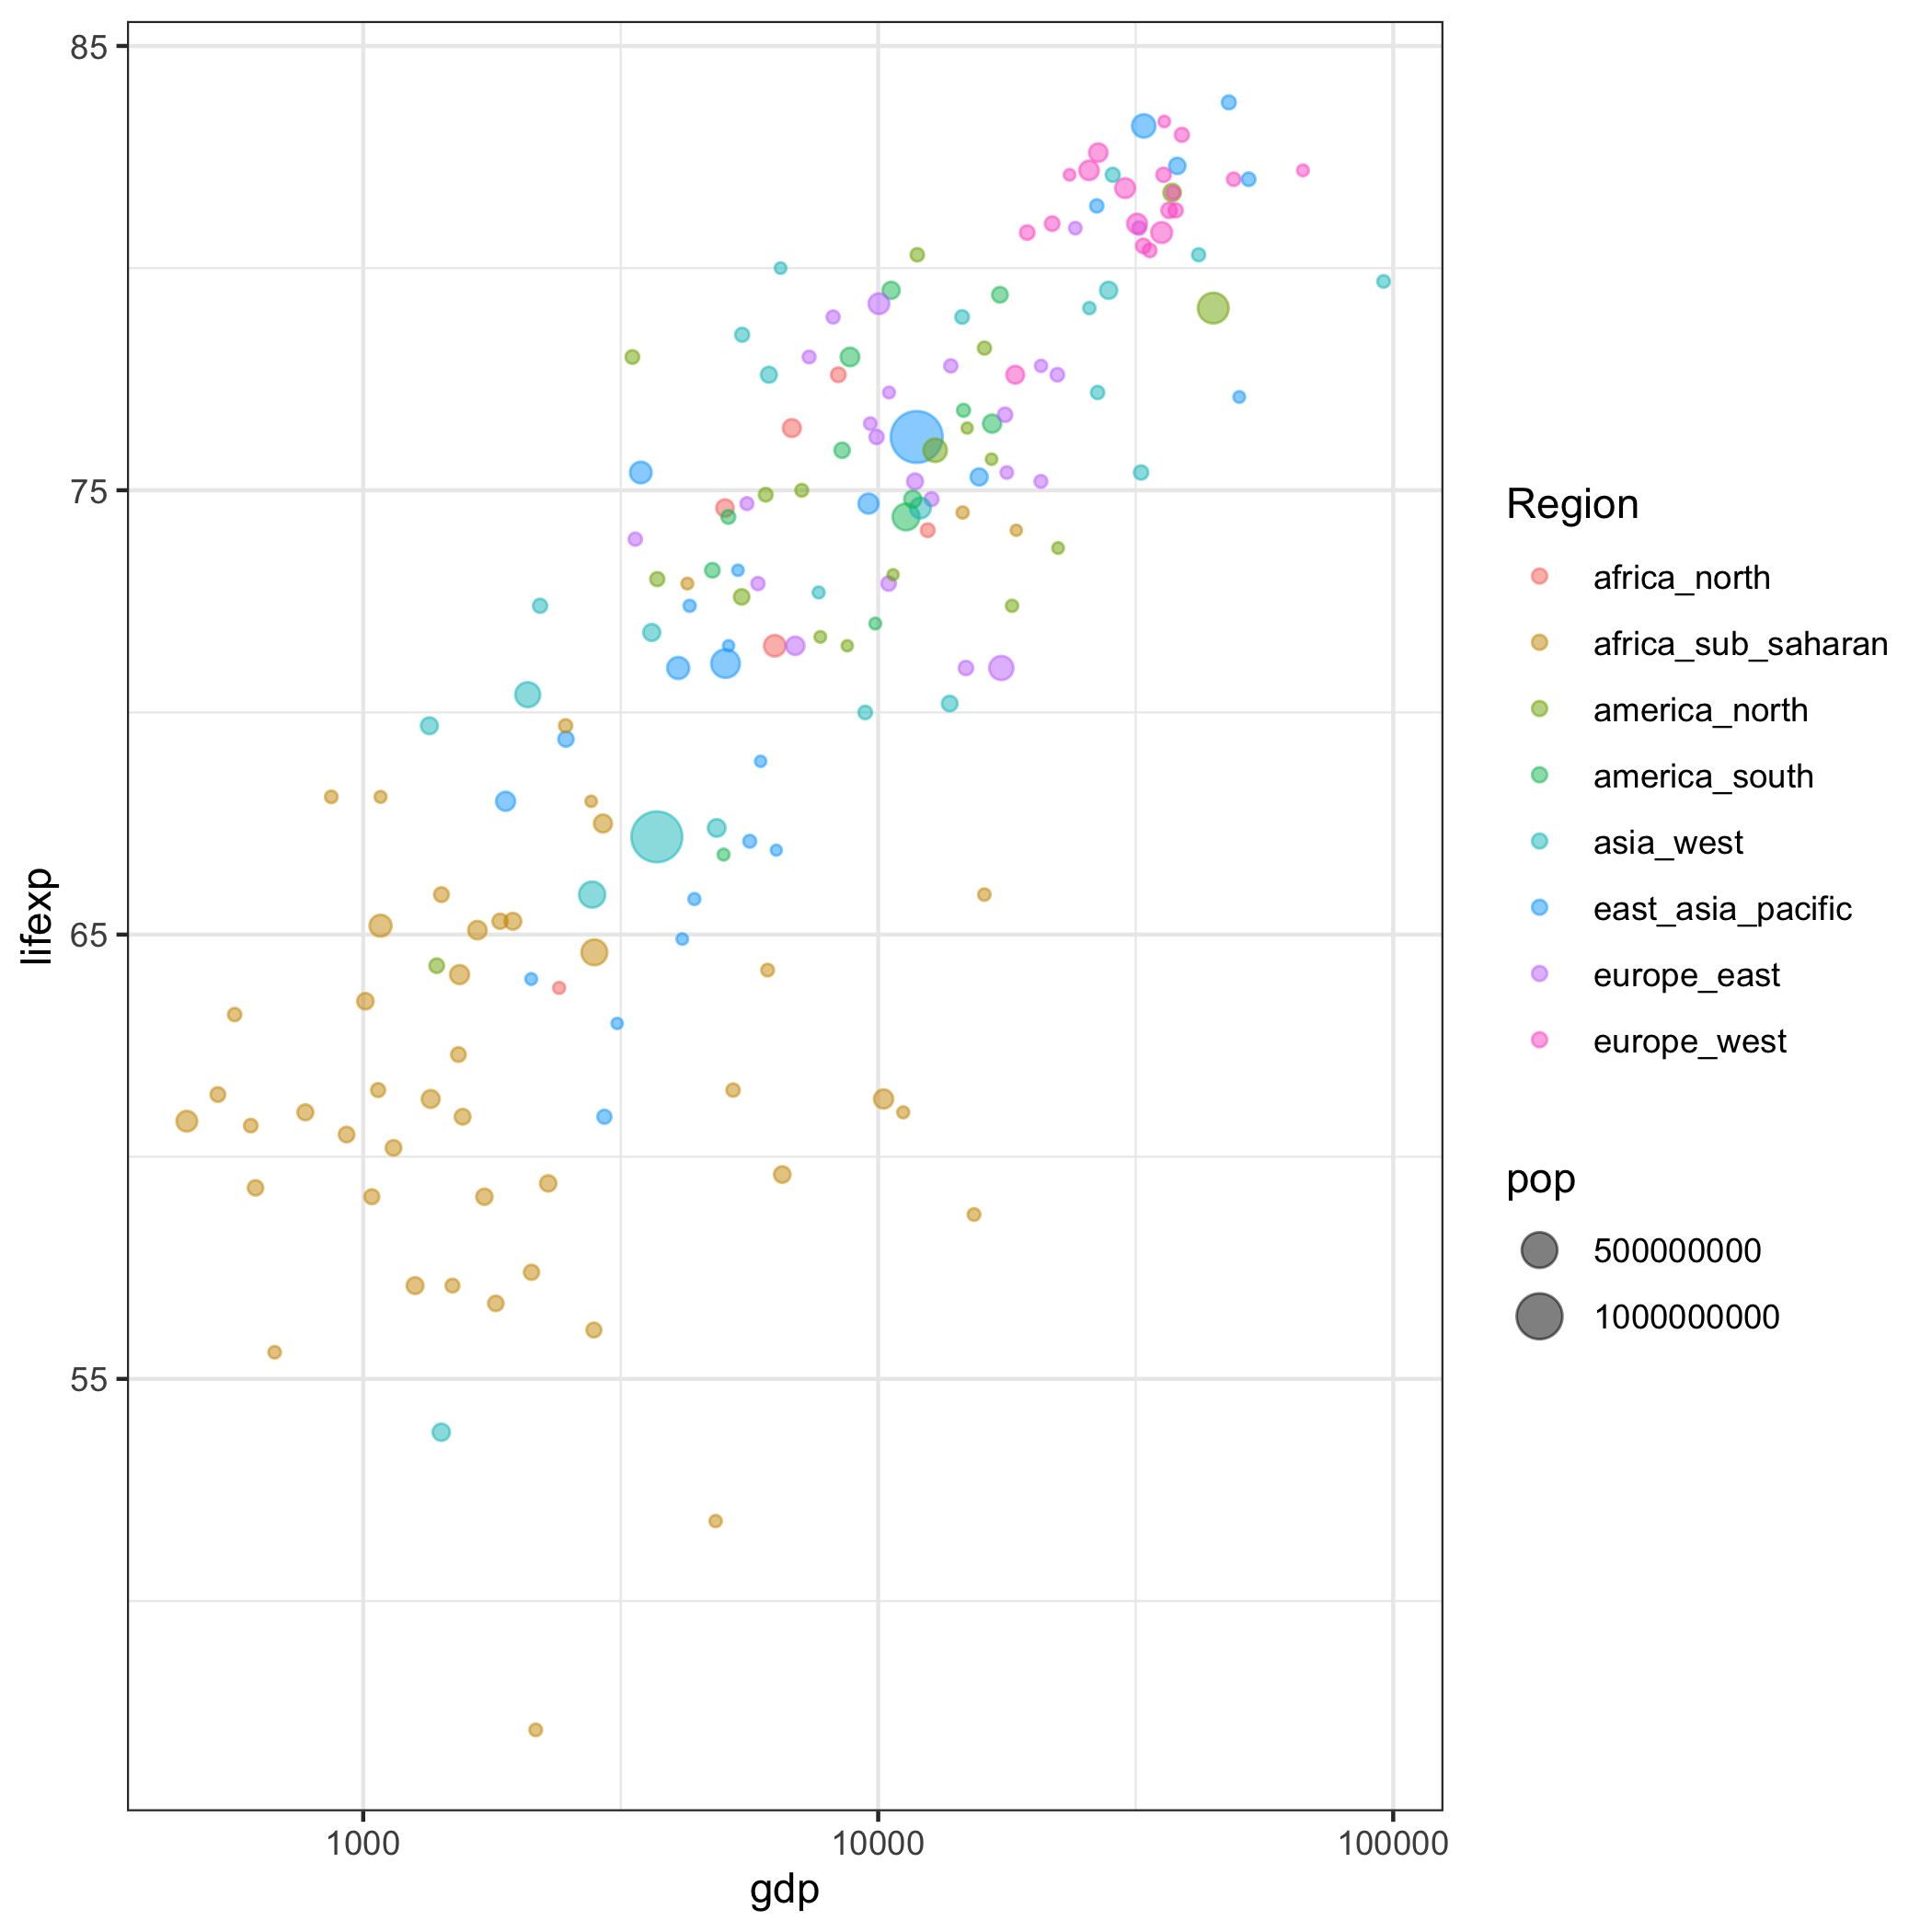<!-- --> ] --- ## Диаграмма рассеяния .pull-left[ .code-small[ ``` r tablab = tabreg |> # табличка для подписей filter(pop > 1e8 | gdp == min(gdp) | gdp == max(gdp) | lifexp == min(lifexp) | lifexp == max(lifexp)) ggplot(tabreg, aes(gdp, lifexp, color = Region)) + geom_point(aes(size = pop), alpha = 0.5) + geom_text_repel(data = tablab, aes(label = Country), box.padding = 0.7, segment.size = 0.2, show.legend = FALSE) + scale_x_log10() + labs(label = element_blank()) + theme_bw() ``` ] ] .pull-right[ 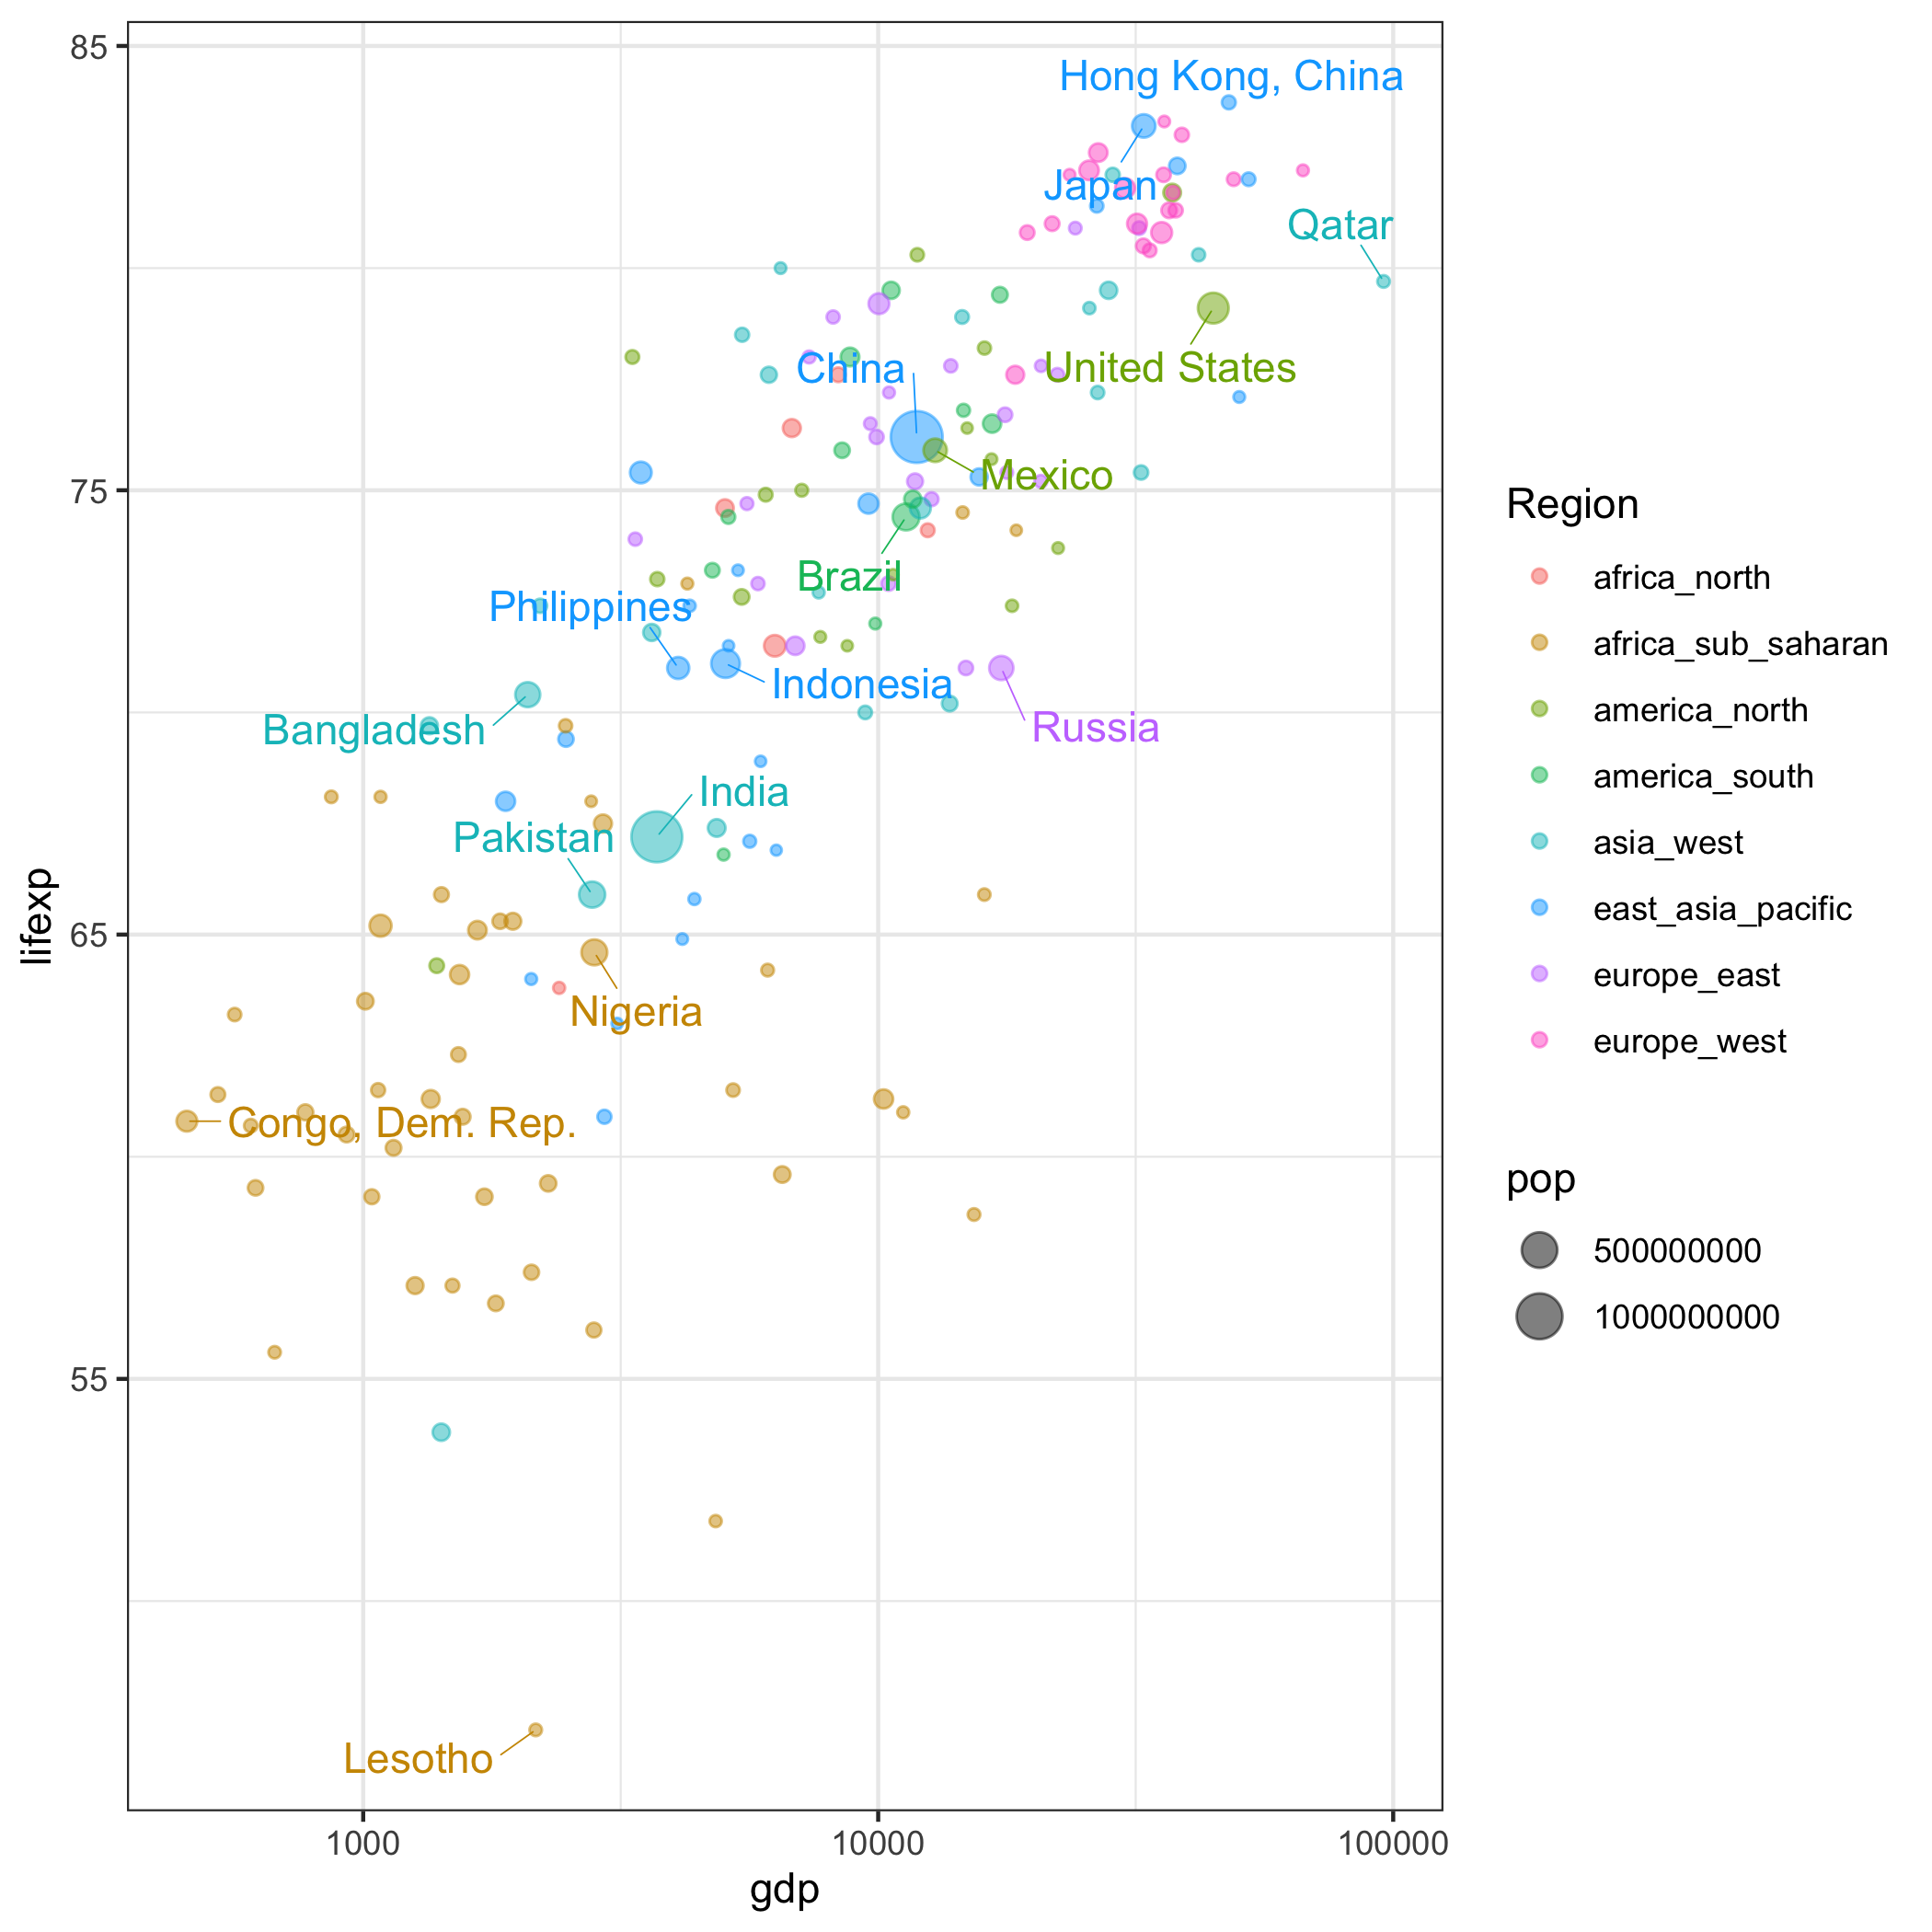<!-- --> ] --- ## Плотность распределения (изолинии) .pull-left[ Строится через `geom_density_2d()`: .code-small[ ``` r ggplot(tabreg, aes(gdp, lifexp)) + geom_point(alpha = 0.5) + geom_density_2d()+ scale_x_log10() + theme_bw() ``` ] ] .pull-right[ 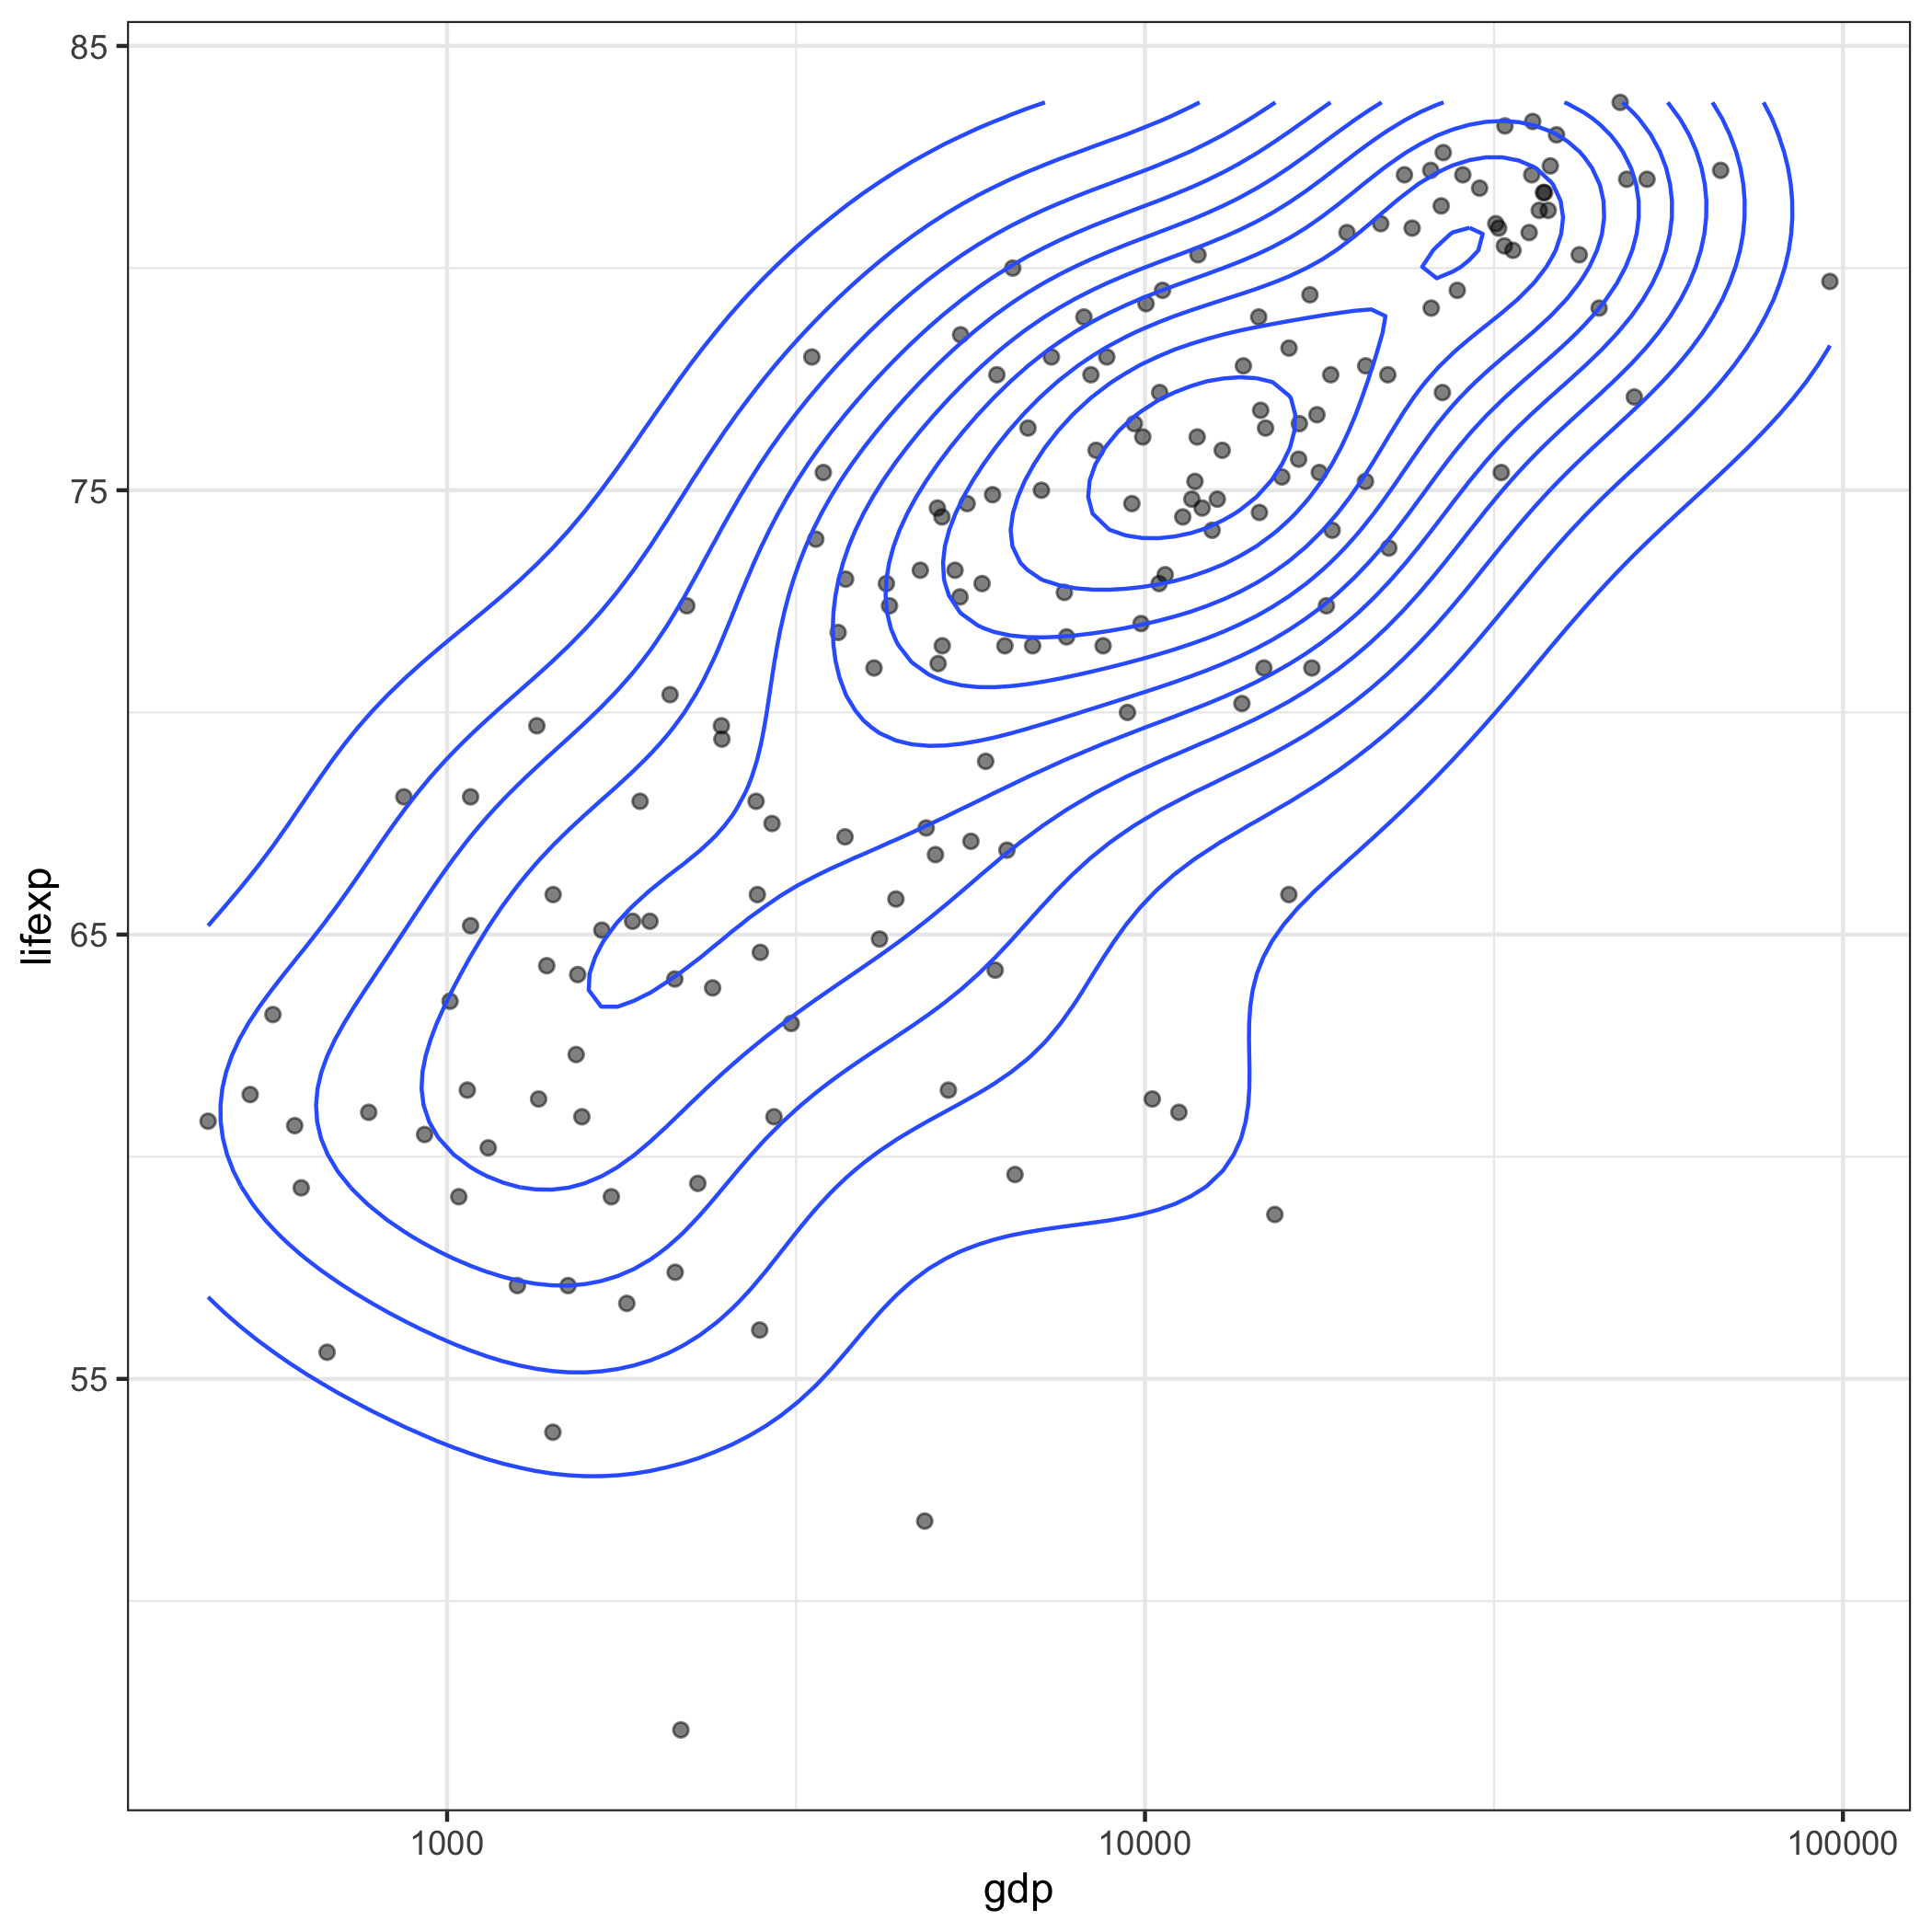<!-- --> ] --- ## Плотность распределения (поверхность) .pull-left[ Строится через `geom_density_2d()`: .code-small[ ``` r ggplot(tabreg, aes(gdp, lifexp)) + stat_density_2d( geom = "raster", aes(fill = stat(density)), contour = FALSE) + geom_density_2d( color = 'black', size = 0.2 ) + geom_point(alpha = 0.5) + scale_fill_gradient(low = "white", high = "red") + scale_x_log10() + theme_bw() ``` ] ] .pull-right[ 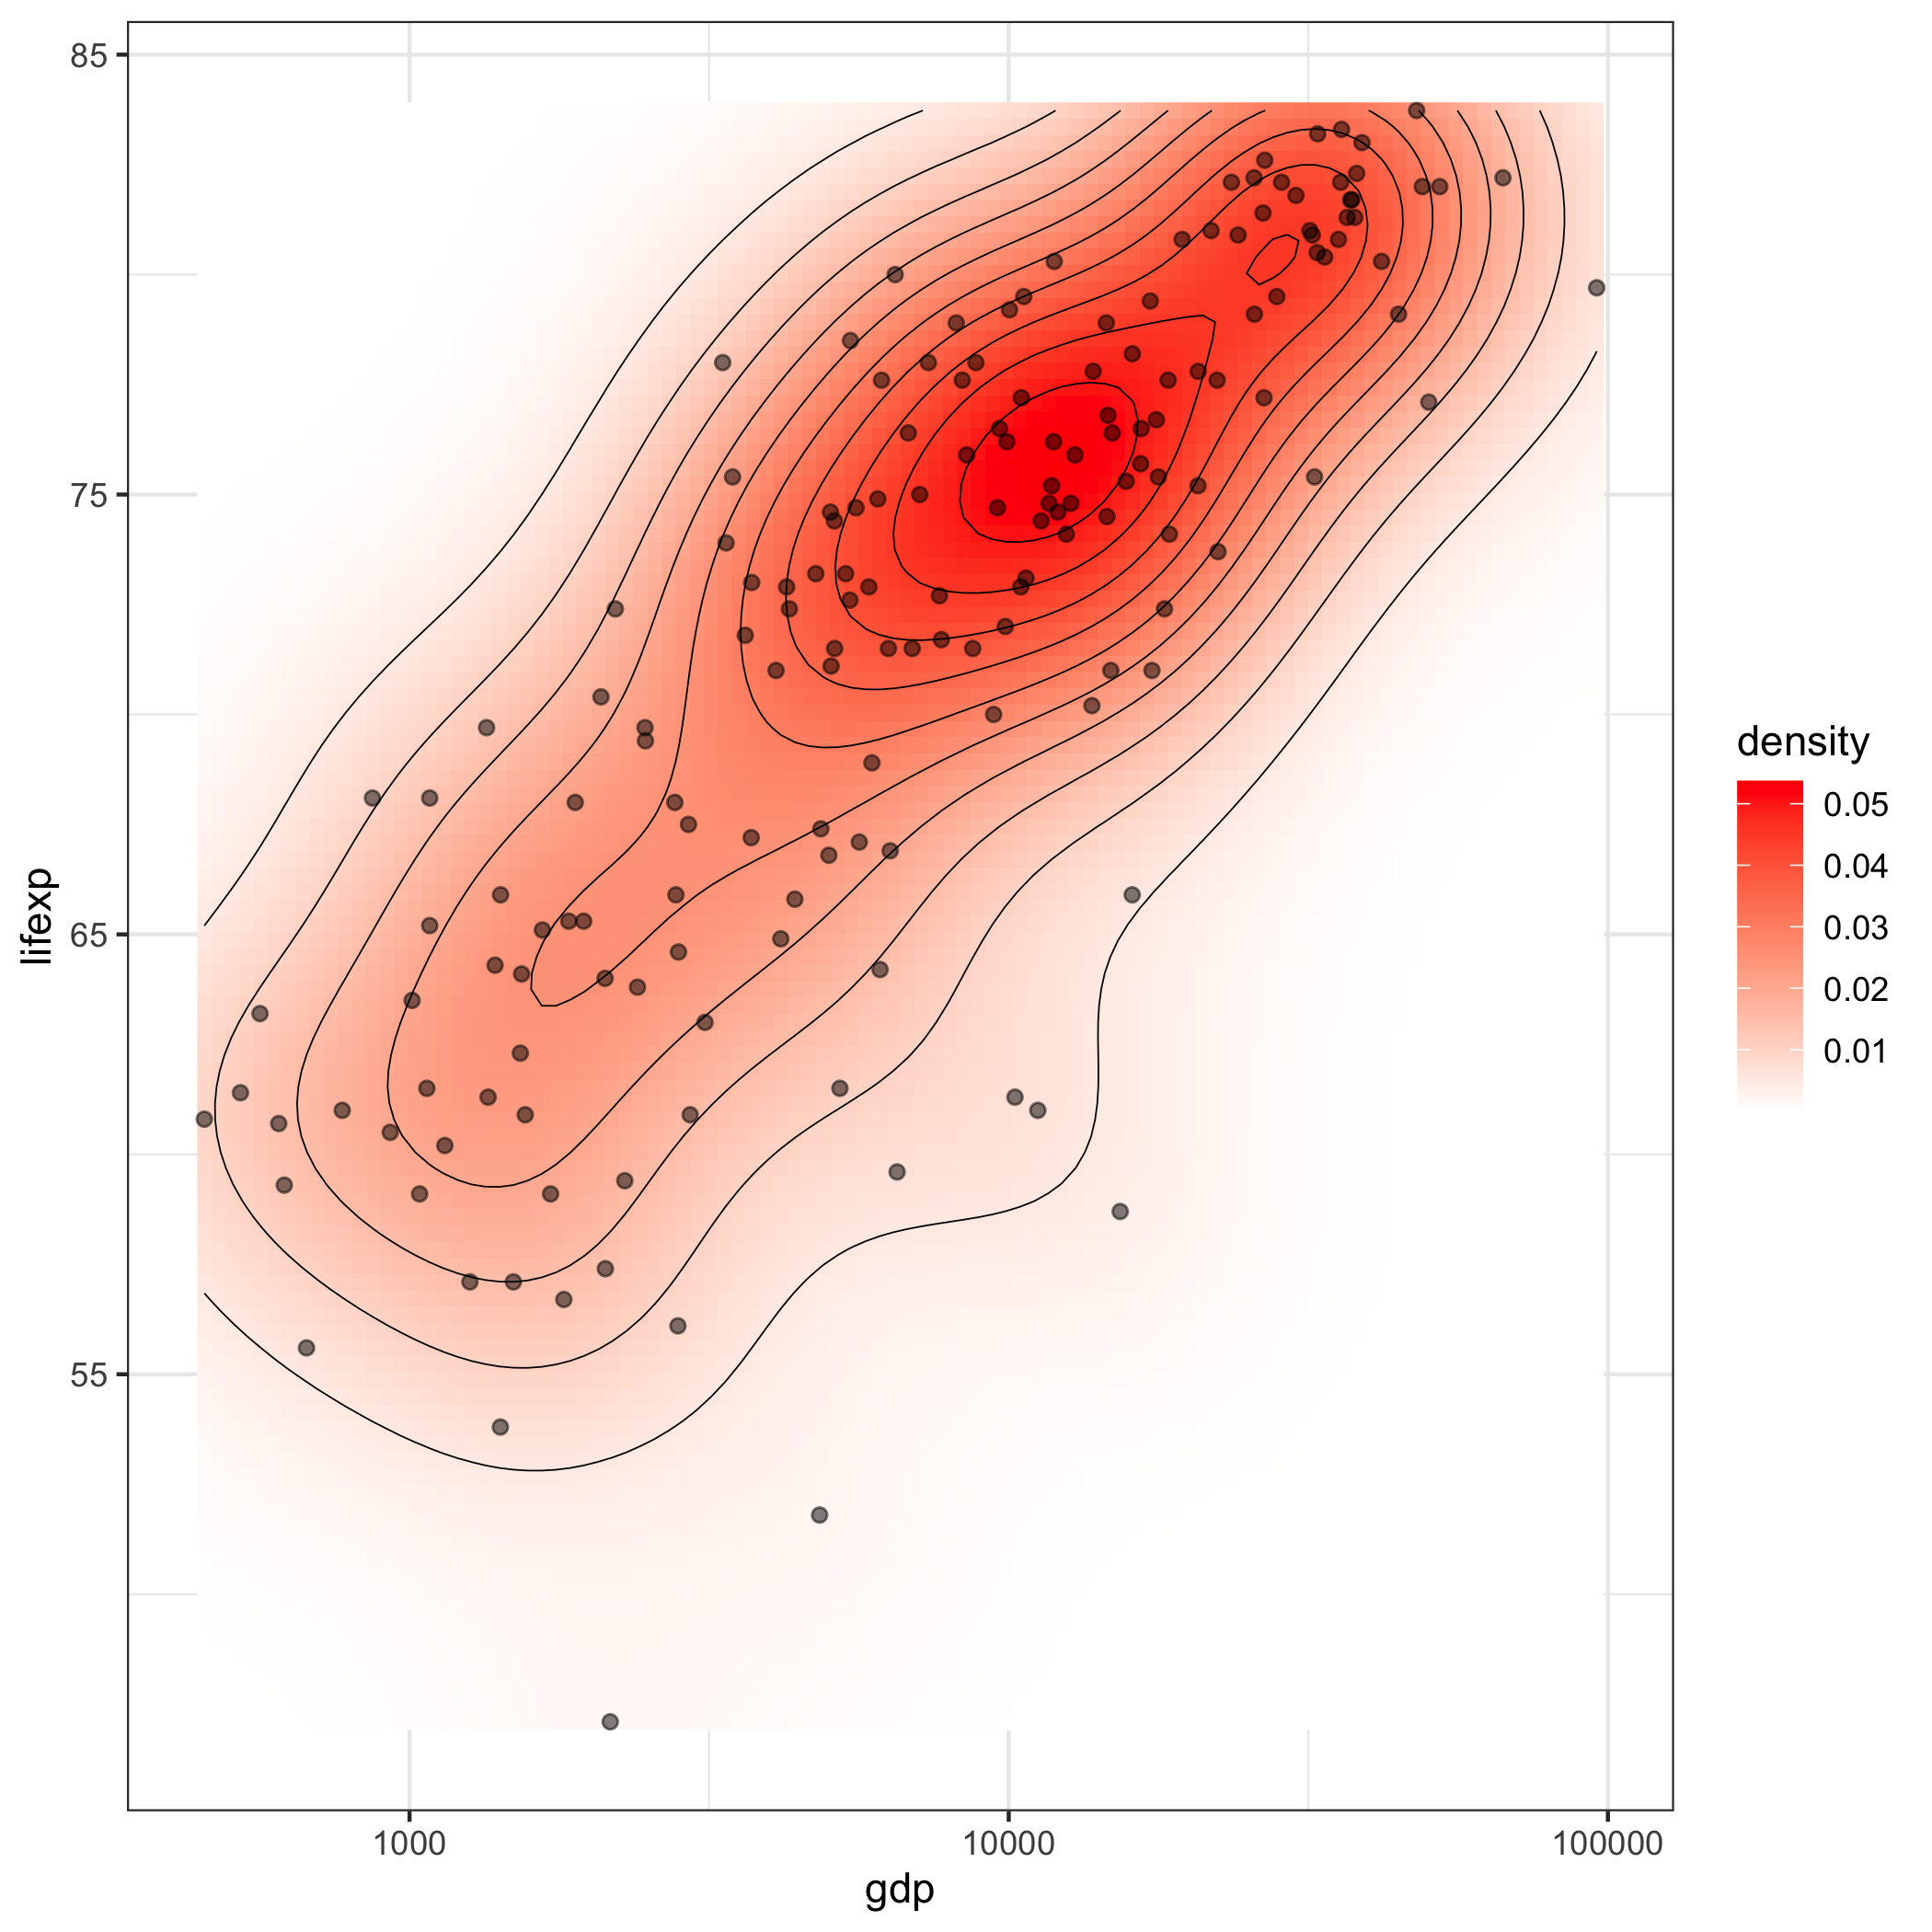<!-- --> ] --- ## Биннинг (агрегирование по ячейкам) .pull-left[ .code-small[ ``` r ggplot(tabreg, aes(gdp, lifexp)) + geom_bin2d(bins = 10)+ geom_point(alpha = 0.5) + scale_fill_gradient(low = "white", high = "red") + scale_x_log10() + theme_bw() ``` <!-- --> ] ] .pull-right[ .code-small[ ``` r ggplot(tabreg, aes(gdp, lifexp)) + geom_hex(bins = 10) + geom_point(alpha = 0.5) + scale_fill_gradient(low = "white", high = "red") + scale_x_log10() + theme_bw() ``` <!-- --> ] ] --- ## Корреляция Коэффициент корреляции Пирсона через `cor.test()`: ``` r cor.test(tabreg$gdp, tabreg$lifexp) ## ## Pearson's product-moment correlation ## ## data: tabreg$gdp and tabreg$lifexp ## t = 11.376, df = 170, p-value < 0.00000000000000022 ## alternative hypothesis: true correlation is not equal to 0 ## 95 percent confidence interval: ## 0.5632175 0.7347928 ## sample estimates: ## cor ## 0.6574446 ``` --- ## Корреляция Предварительное логарифмирование: ``` r cor.test(log(tabreg$gdp), tabreg$lifexp) ## ## Pearson's product-moment correlation ## ## data: log(tabreg$gdp) and tabreg$lifexp ## t = 17.327, df = 170, p-value < 0.00000000000000022 ## alternative hypothesis: true correlation is not equal to 0 ## 95 percent confidence interval: ## 0.7375973 0.8473619 ## sample estimates: ## cor ## 0.7990415 ``` --- ## Регрессия Оценка параметров линейных моделей осуществляется с помощью функции `lm()`: ``` r model = lm(lifexp ~ log(gdp), data = tabreg) summary(model) ## ## Call: ## lm(formula = lifexp ~ log(gdp), data = tabreg) ## ## Residuals: ## Min 1Q Median 3Q Max ## -18.4327 -1.9398 0.6394 3.1638 10.1937 ## ## Coefficients: ## Estimate Std. Error t value Pr(>|t|) ## (Intercept) 25.1293 2.7178 9.246 <0.0000000000000002 *** ## log(gdp) 5.2615 0.3037 17.327 <0.0000000000000002 *** ## --- ## Signif. codes: 0 '***' 0.001 '**' 0.01 '*' 0.05 '.' 0.1 ' ' 1 ## ## Residual standard error: 4.785 on 170 degrees of freedom ## Multiple R-squared: 0.6385, Adjusted R-squared: 0.6363 ## F-statistic: 300.2 on 1 and 170 DF, p-value: < 0.00000000000000022 ``` --- ## Регрессия Аппроксимированные значения извлекаются через `fitted()`: .pull-left[ ``` r df = tibble(lifexp = fitted(model), gdp = tabreg$gdp) ggplot(tabreg, aes(gdp, lifexp)) + geom_point(alpha = 0.5) + geom_line(data = df, aes(gdp, lifexp), color = 'red', size = 1) + theme_bw() ``` ] .pull-right[ 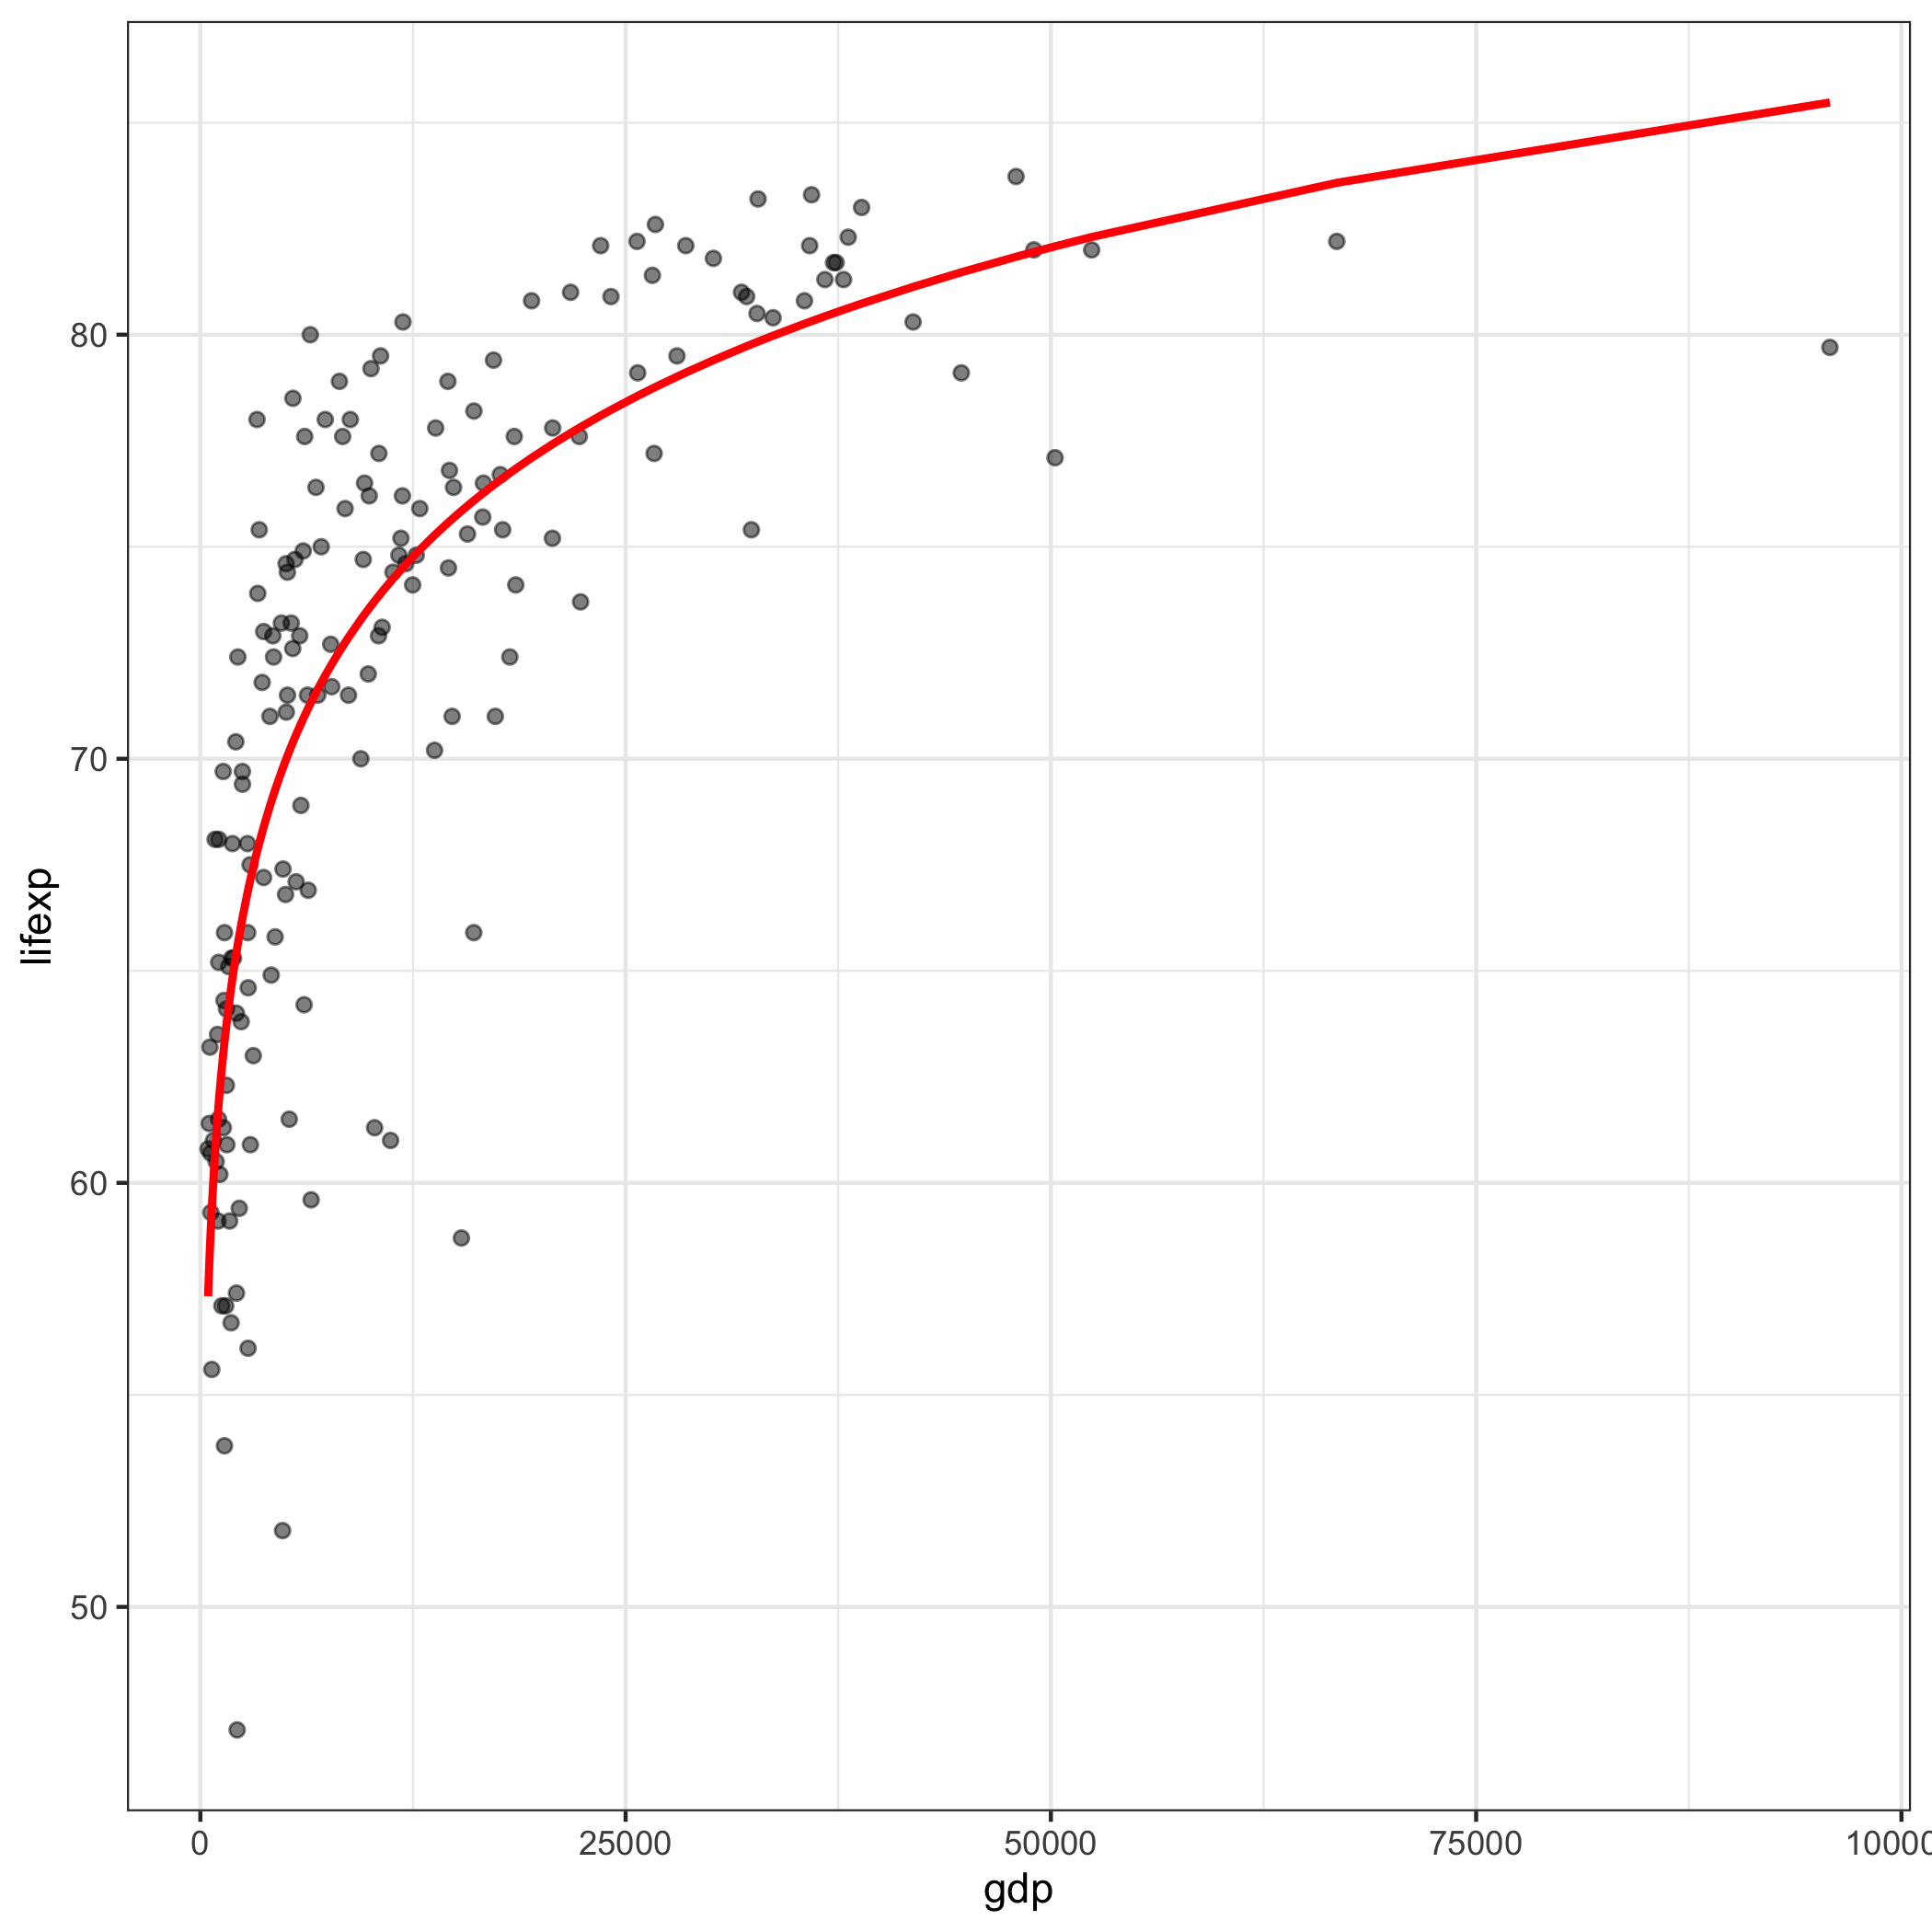<!-- --> ] --- ## Регрессия — визуализация .pull-left[ __ggplot__ содержит геометрию `geom_smooth()`: ``` r ggplot(tabreg, aes(gdp, lifexp)) + geom_point(alpha = 0.5) + geom_smooth(method = 'lm', color = 'red', size = 1) + scale_x_log10() + theme_bw() ``` ] .pull-right[ 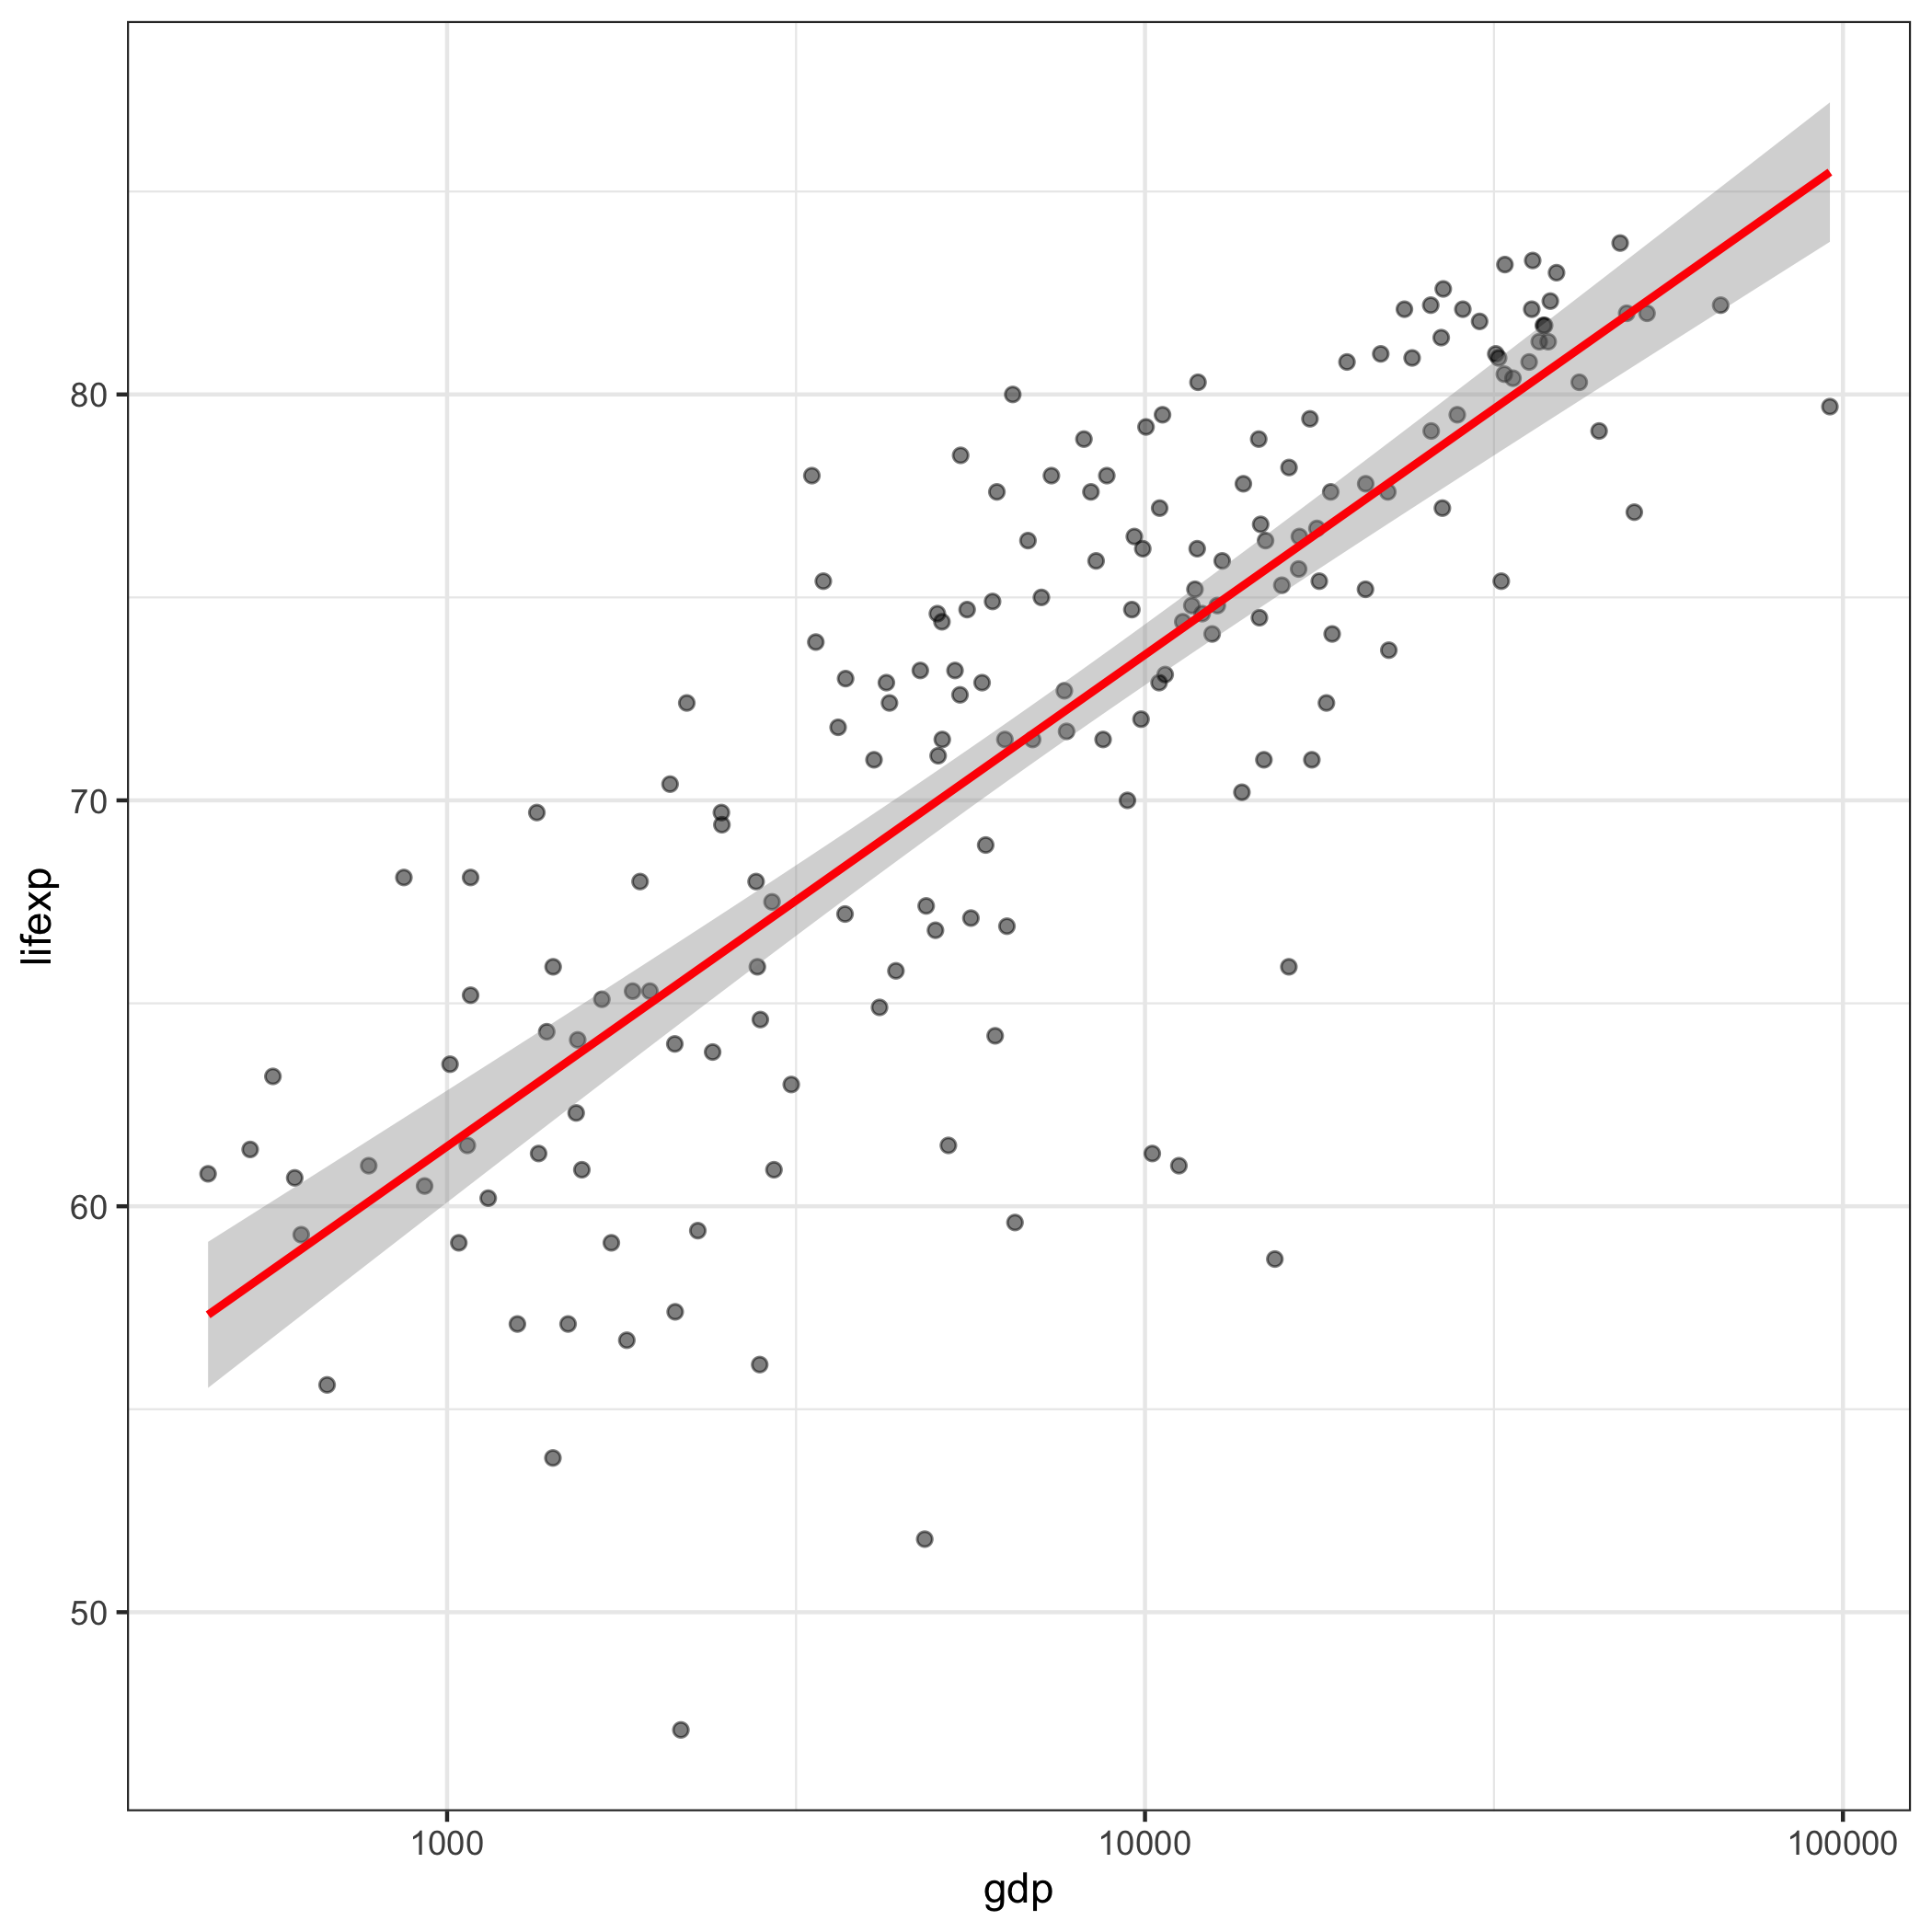<!-- --> ]