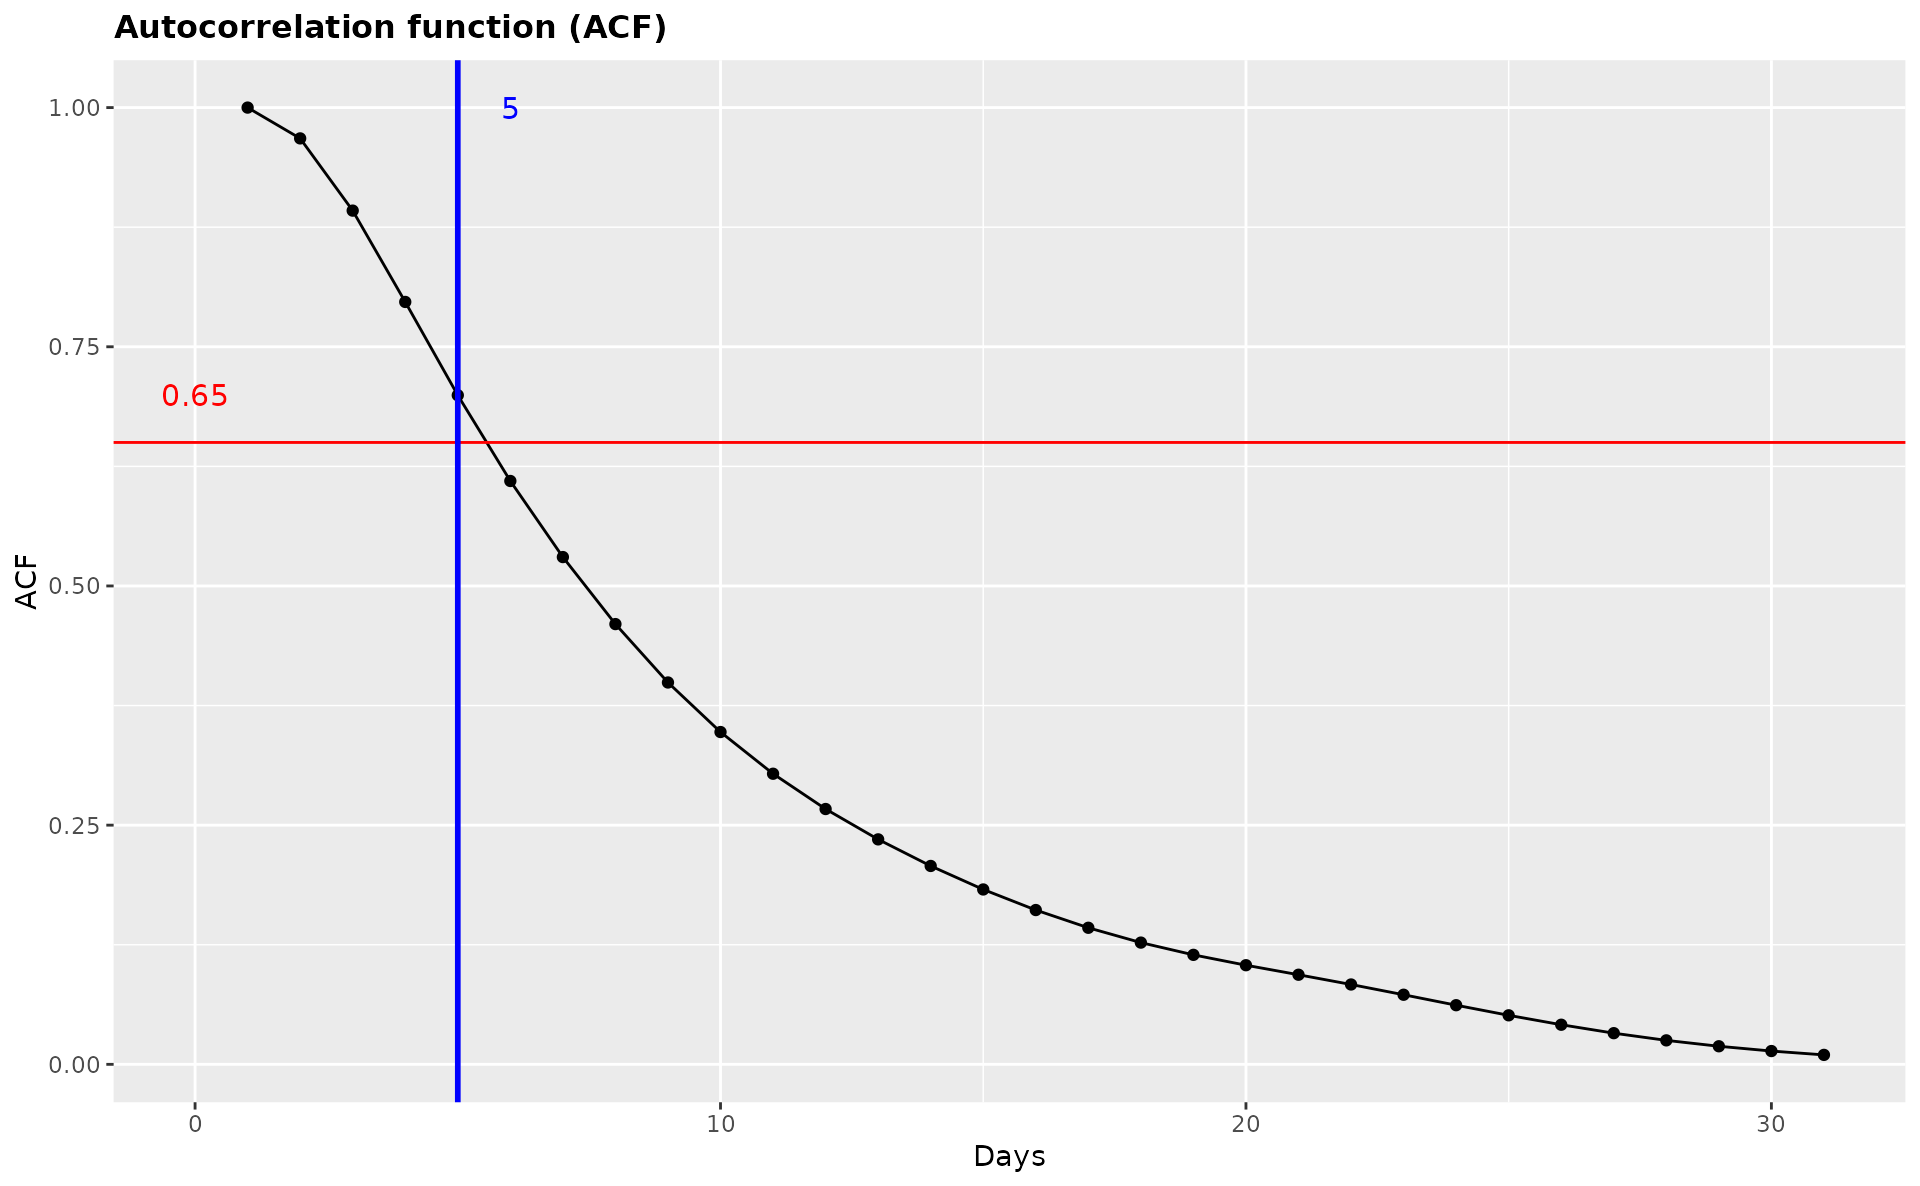
The function plots the autocorrelation function (ACF) for daily runoff time series. A number of days corresponding to the specified autocorr value is highlighted.
Arguments
- hdata
data.framewith first column asDateand the second column as runoff- autocorr
Numeric value of the autocorrelation for which the time period will be highlighted. Defaults to
0.7.- maxlag
Integer value of the maximum daily lag used to calculate the correlation. Defaults to
30.Boolean. Print plot? Defaults to
TRUE. UseFALSEif you want to tweak the plot aesthetics before plotting.
Examples
library(grwat)

# example Spas-Zagorye data is included with grwat package
data(spas)
head(spas)
#> # A tibble: 6 × 4
#>   Date           Q   Temp  Prec
#>   <date>     <dbl>  <dbl> <dbl>
#> 1 1956-01-01  5.18  -6.46 0.453
#> 2 1956-01-02  5.18 -11.4  0.825
#> 3 1956-01-03  5.44 -10.7  0.26
#> 4 1956-01-04  5.44  -8.05 0.397
#> 5 1956-01-05  5.44 -11.7  0.102
#> 6 1956-01-06  5.58 -20.1  0.032

# plot ACF
gr_plot_acf(spas, 0.65)