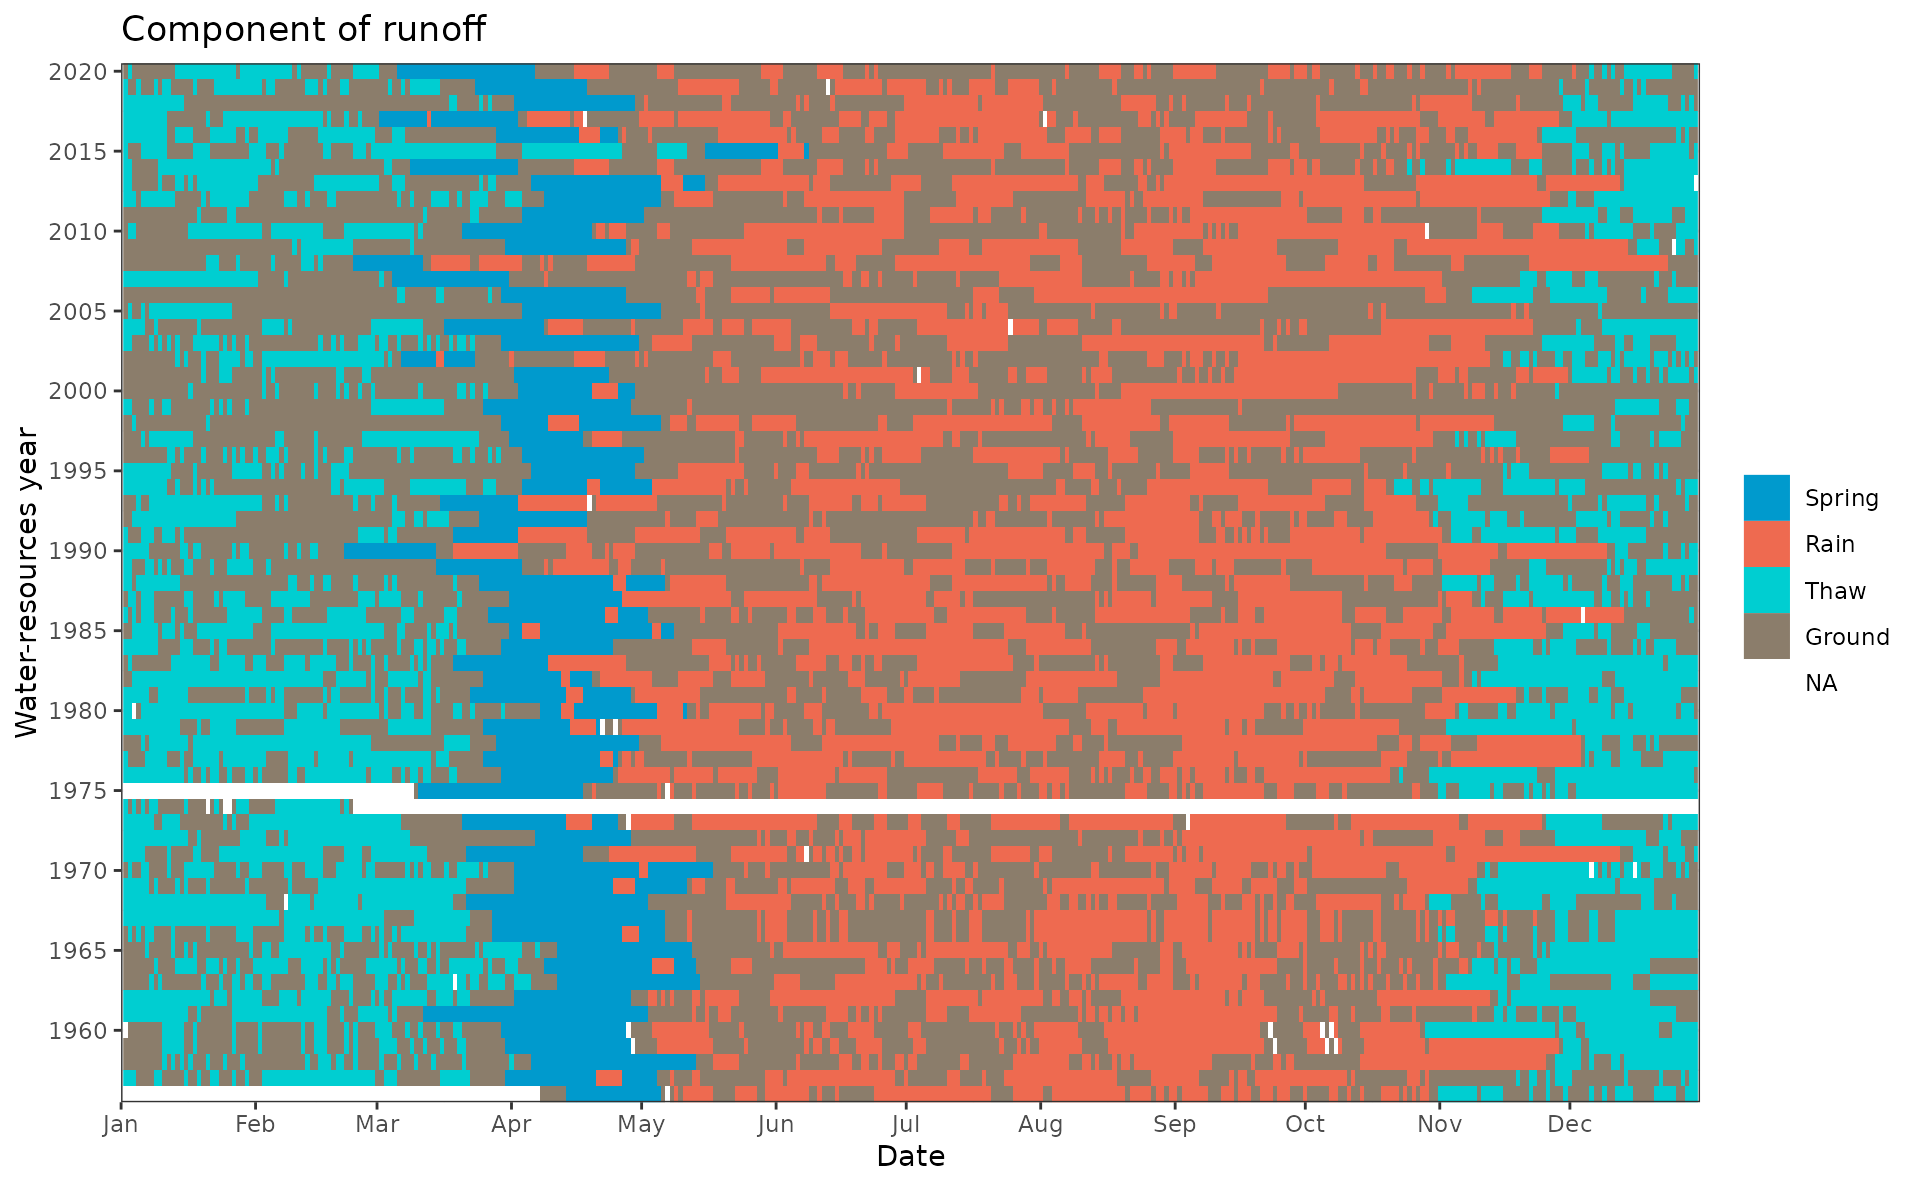
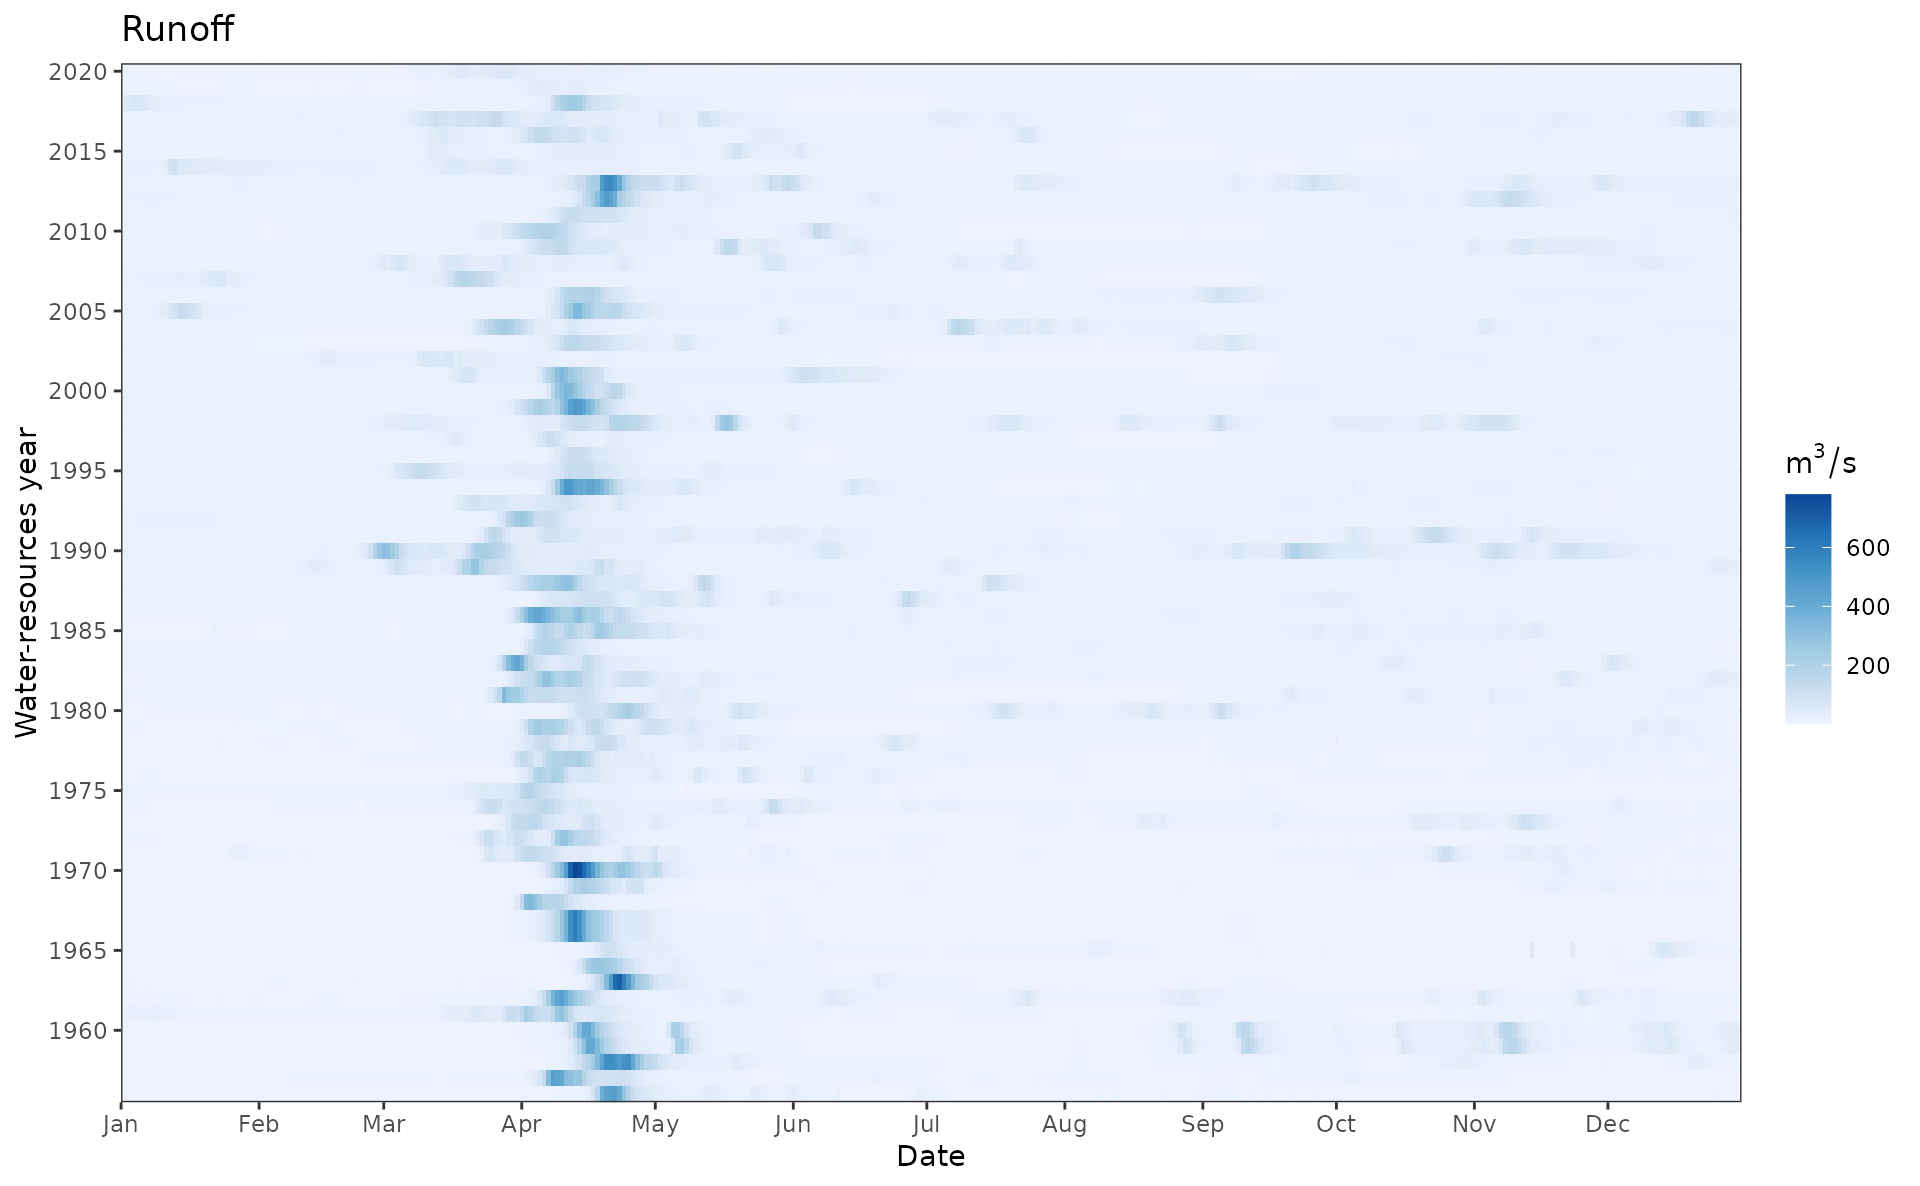
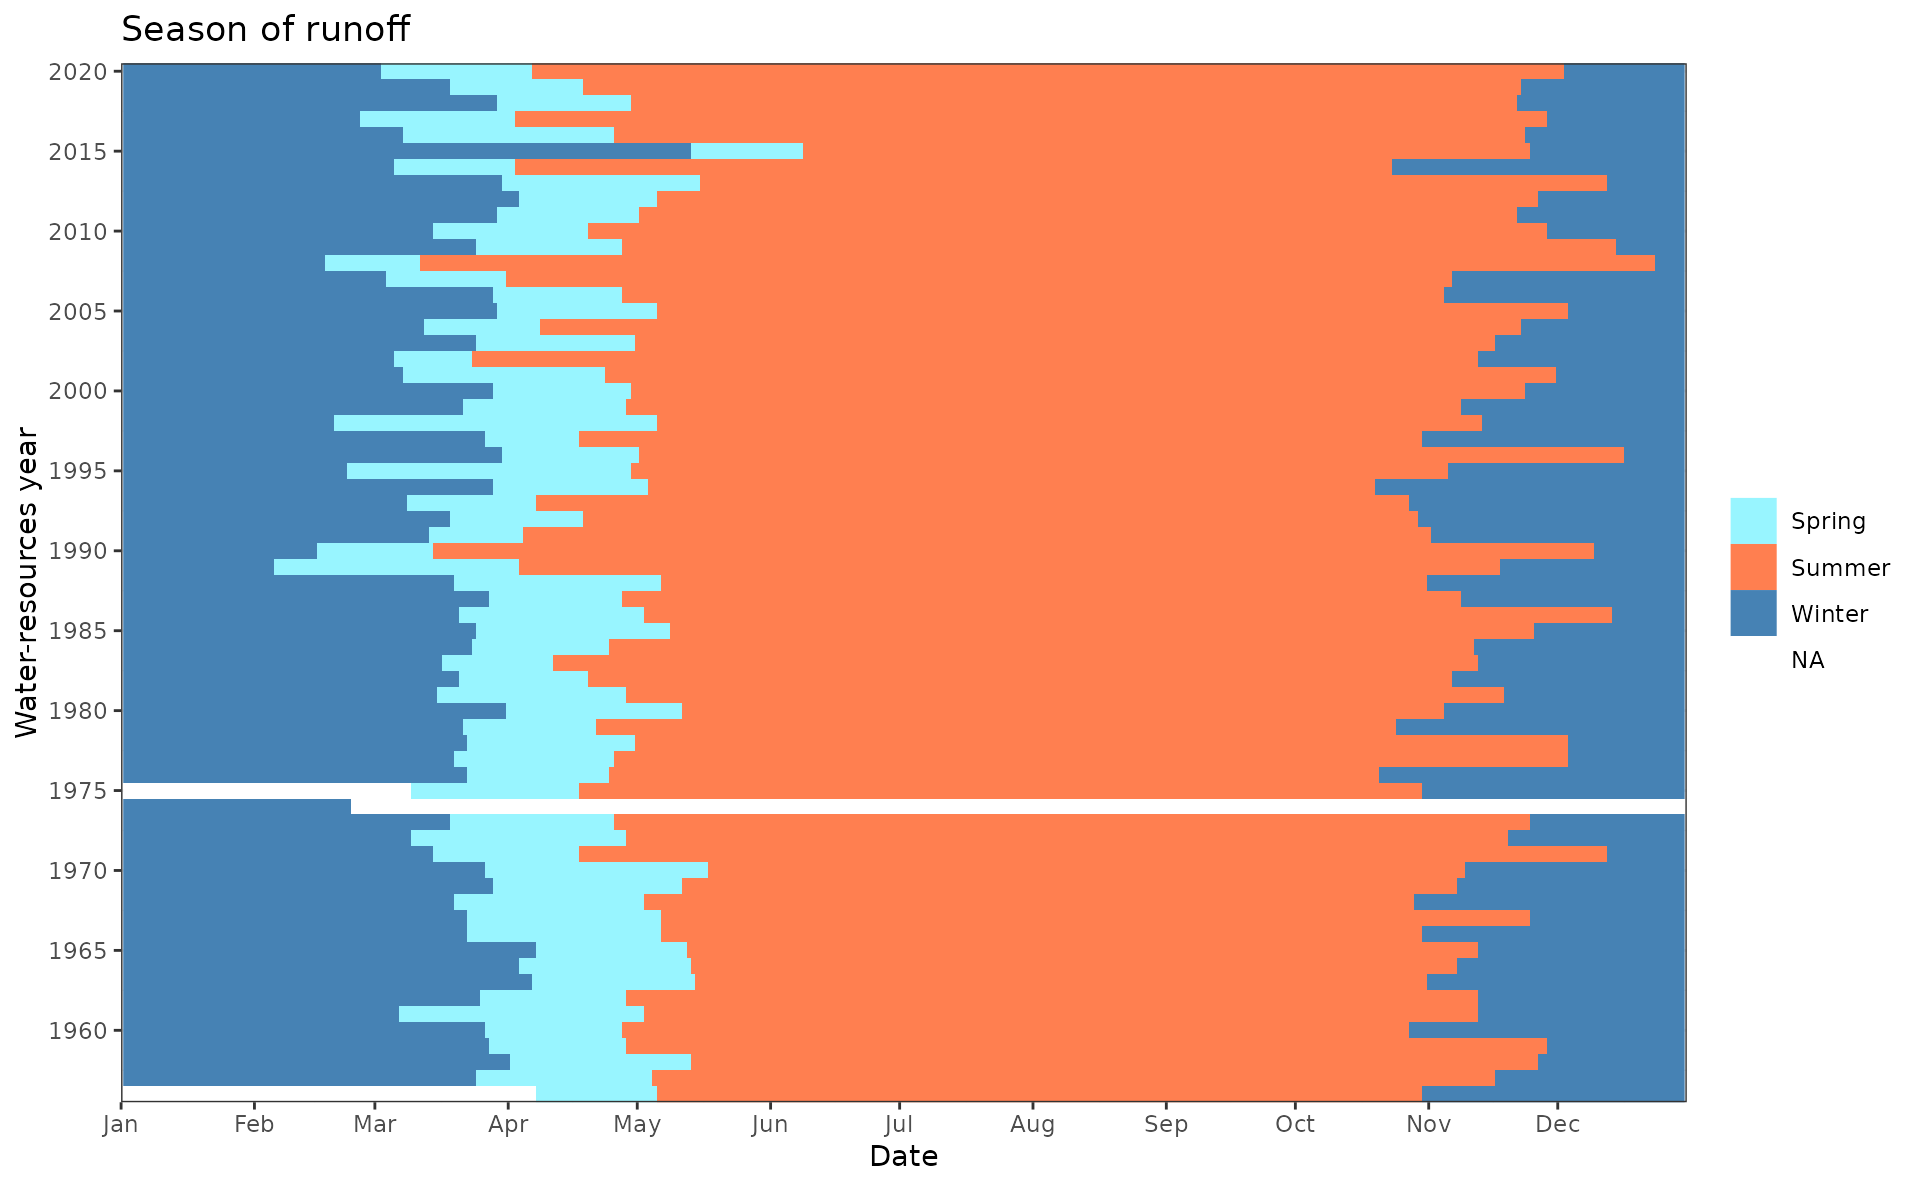
The function plots runoff values, components and seasons using the matrix-based approach. The X axis corresponds to the day of the year, and the Y axis corresponds to the year. The function is useful when the whole picture of river runoff needs to be assessed.
Arguments
- df
data.frameof hydrograph separation produced bygr_separate().- years
Integer vector of years to be plotted. Defaults to
NULL.- type
Character string. Supported options are
'runoff','component', and'season'. Defaults to'runoff'.Boolean. Print plot? Defaults to
TRUE. UseFALSEif you want to tweak the plot aesthetics before plotting.
Value
ggplot2 object representing the runoff values, components or seasons using the matrix-based approach
Examples
library(grwat)
data(spas) # example Spas-Zagorye data is included with grwat package
# separate
sep = gr_separate(spas, params = gr_get_params(reg = 'center'))
#> grwat: data frame is correct
#> grwat: parameters list and types are OK
# matrix plot for runoff
gr_plot_matrix(sep, type = 'runoff')
#> Warning: Removed 147 rows containing missing values or values outside the scale range
#> (`geom_raster()`).
 # matrix plot for seasons
gr_plot_matrix(sep, type = 'season')
#> Warning: Removed 147 rows containing missing values or values outside the scale range
#> (`geom_raster()`).
# matrix plot for seasons
gr_plot_matrix(sep, type = 'season')
#> Warning: Removed 147 rows containing missing values or values outside the scale range
#> (`geom_raster()`).
 # matrix plot for genetic components
gr_plot_matrix(sep, type = 'component')
#> Warning: Removed 147 rows containing missing values or values outside the scale range
#> (`geom_raster()`).
# matrix plot for genetic components
gr_plot_matrix(sep, type = 'component')
#> Warning: Removed 147 rows containing missing values or values outside the scale range
#> (`geom_raster()`).