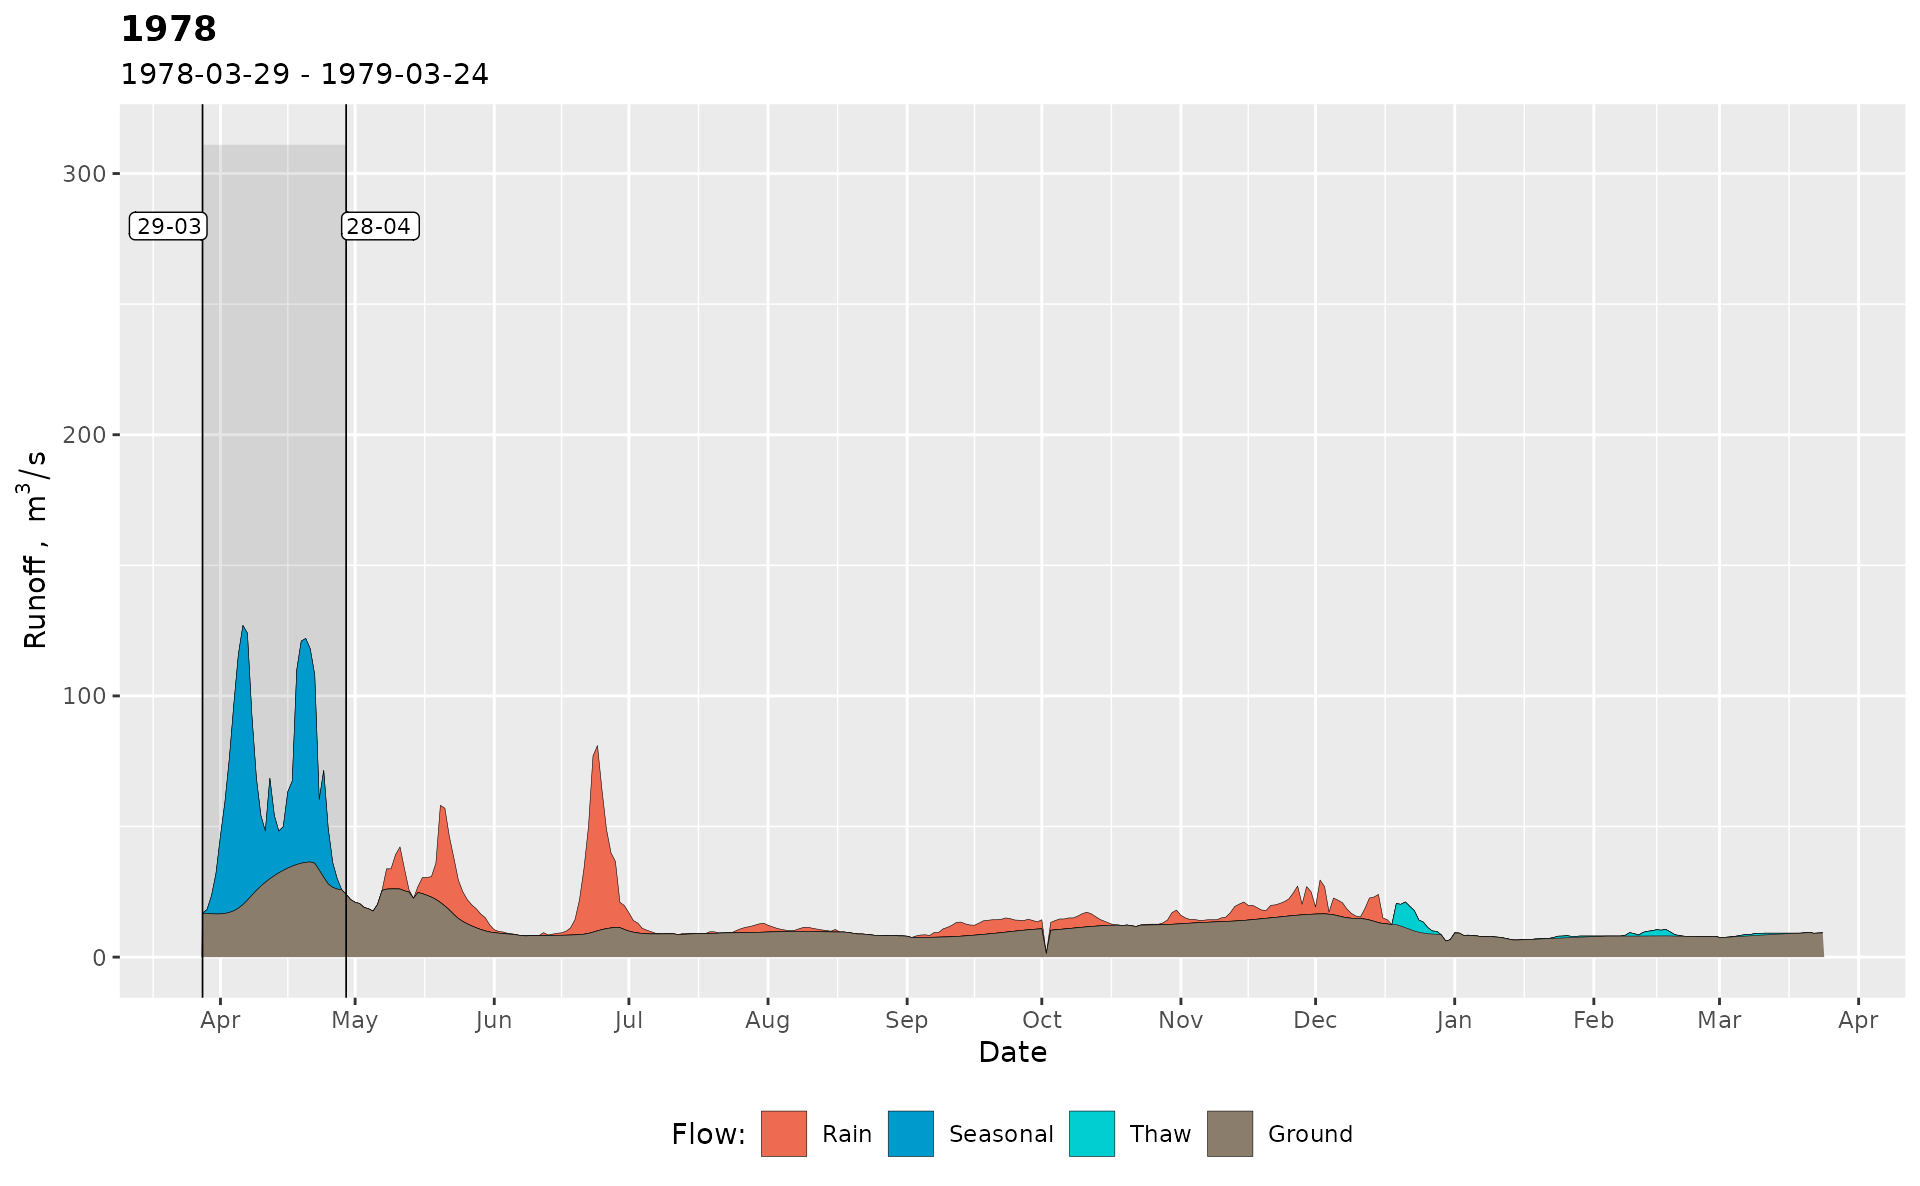
Separates the runoff into genetic components: groundwater, thaw, rain and spring.
Usage
gr_separate(df, params = gr_get_params(), debug = FALSE)Arguments
- df
data.framewith four columns: date, runoff, temperature, precipitation.- params
listof separation parameters, as returned bygr_get_params()function. Can also be alistof suchlists if modified parameters are required for some years. In this case the length ofparamsmust be equal to the number of calendar years indfor be equal to1.- debug
Boolean. If
TRUEthen additional attributesjitteredandparamsare written to the outputdata.frame.jitteredis an integer vector of years for which the separation parameters were randomly jittered.paramsis a list of separation parameter lists used for each year (some o those may have been jittered). Defaults toFALSE.
Value
A data.frame with 11 columns:
| Column | Description |
Date | date |
Q | total runoff |
Temp | temperature |
Prec | precipitation |
Qbase | baseflow |
Quick | quickflow |
Qspri | spring flood |
Qrain | rain floods |
Qthaw | thaw floods |
Season | a season of the year |
Year | a water-resources year |
Examples
library(grwat)
data(spas) # example Spas-Zagorye data is included with grwat package
head(spas)
#> # A tibble: 6 × 4
#> Date Q Temp Prec
#> <date> <dbl> <dbl> <dbl>
#> 1 1956-01-01 5.18 -6.46 0.453
#> 2 1956-01-02 5.18 -11.4 0.825
#> 3 1956-01-03 5.44 -10.7 0.26
#> 4 1956-01-04 5.44 -8.05 0.397
#> 5 1956-01-05 5.44 -11.7 0.102
#> 6 1956-01-06 5.58 -20.1 0.032
# separate
sep = gr_separate(spas, params = gr_get_params(reg = 'center'))
#> grwat: data frame is correct
#> grwat: parameters list and types are OK
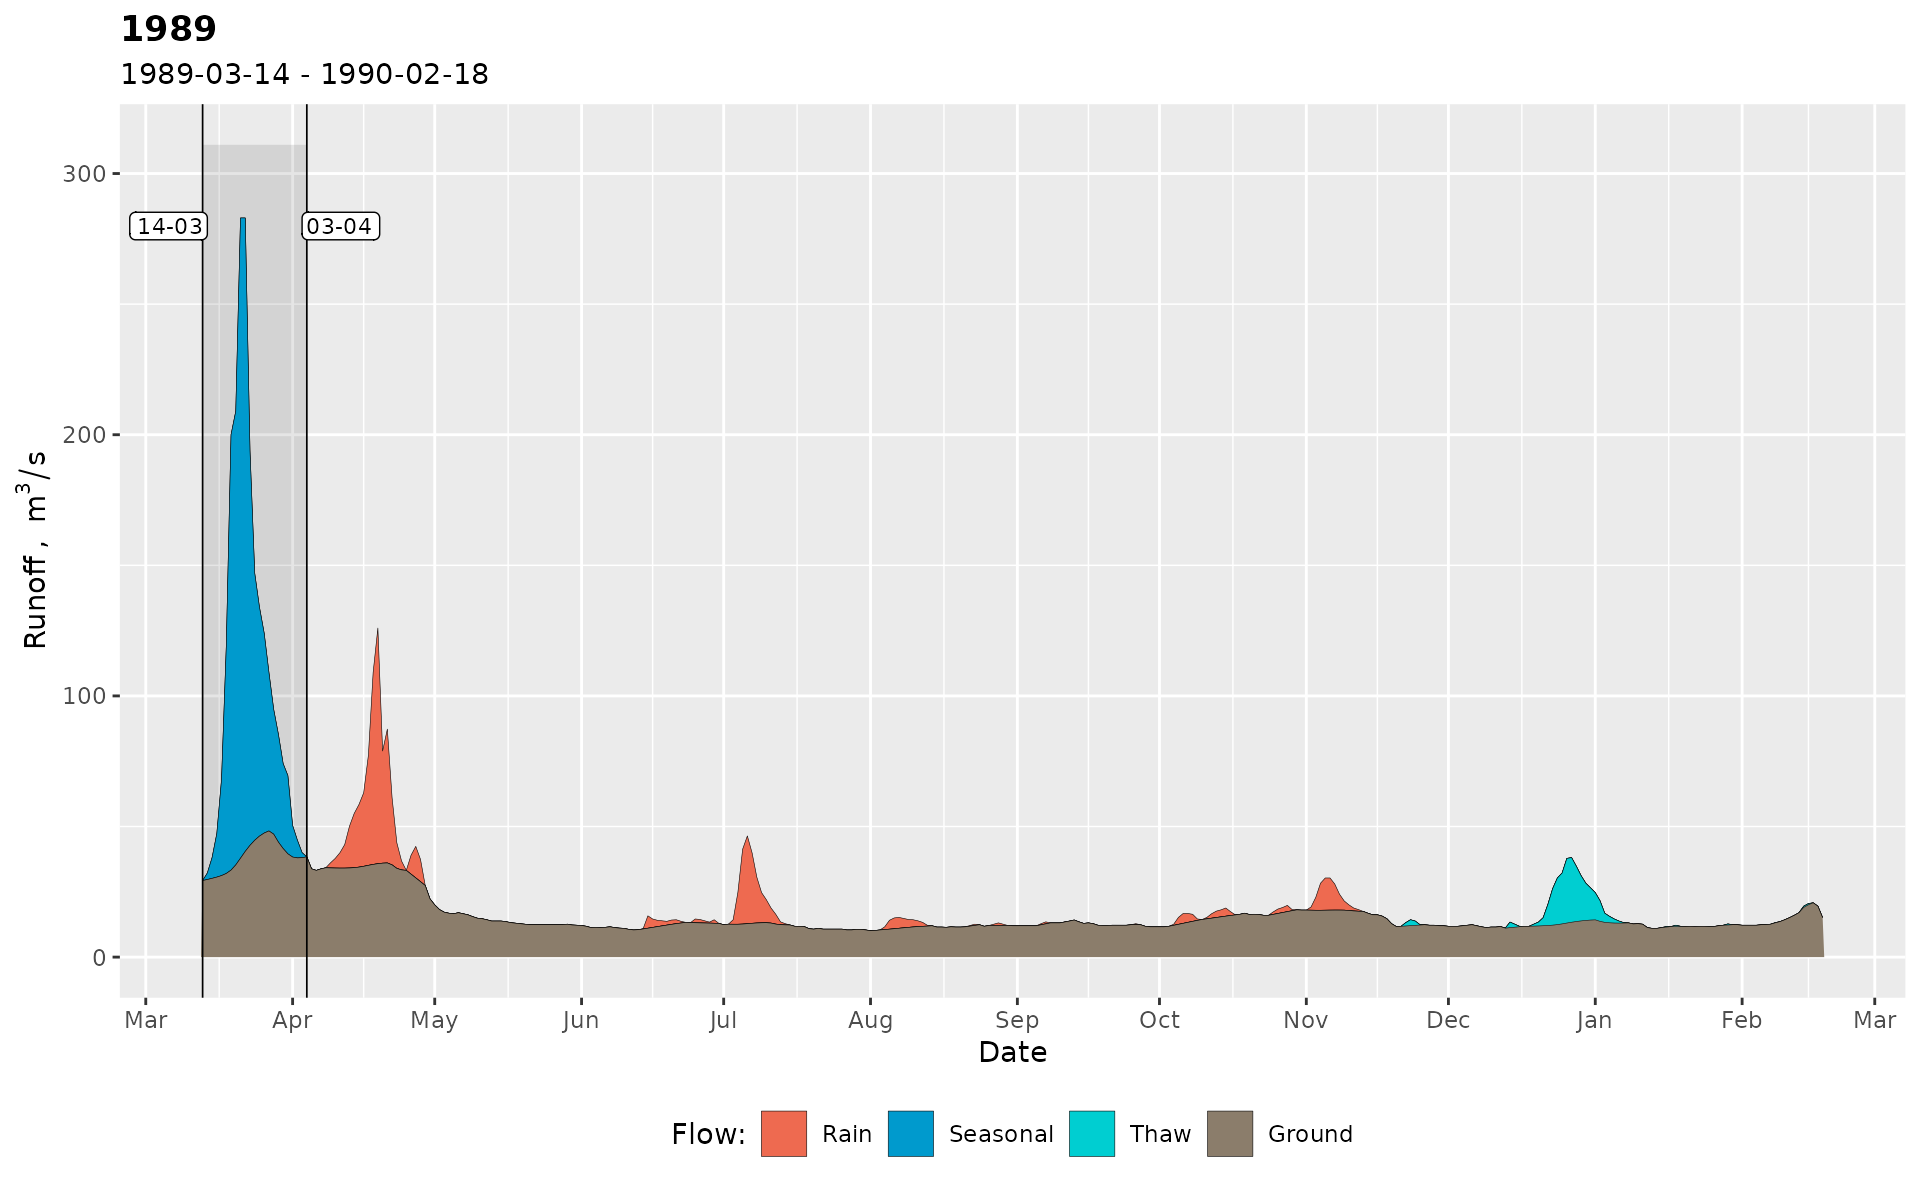
# Visualize
gr_plot_sep(sep, c(1978, 1989))
 # Debug mode gives access to additional information
sep_debug = gr_separate(spas,
params = gr_get_params(reg = 'center'),
debug = TRUE)
#> grwat: data frame is correct
#> grwat: parameters list and types are OK
#> Warning: grwat: 1974 years were not separated. Check the input data for possible errors. Use gr_get_gaps() and gr_fill_gaps() functions to detect and fill missing data.
#> Warning: grwat: 2002, 2014, 2019 years were processed with jittered parameters
# a vector of years with jittered params
jit = attributes(sep_debug)$jittered
print(jit)
#> [1] 2002 2014 2019
# actual params used for each year
parlist = attributes(sep_debug)$params
# tabular representation of parameters
partab = gr_to_pardf(parlist)
head(partab)
#> # A tibble: 6 × 40
#> year winmon grad1 grad2 gratio spmon1 spmon2 sprisedays1 sprisedays2 spdays
#> <int> <dbl> <dbl> <dbl> <dbl> <dbl> <dbl> <dbl> <dbl> <dbl>
#> 1 1956 11 1.7 5 400 2 5 8 10 30
#> 2 1957 11 1.7 5 400 2 5 8 10 30
#> 3 1958 11 1.7 5 400 2 5 8 10 30
#> 4 1959 11 1.7 5 400 2 5 8 10 30
#> 5 1960 11 1.7 5 400 2 5 8 10 30
#> 6 1961 11 1.7 5 400 2 5 8 10 30
#> # ℹ 30 more variables: sprise <dbl>, spratio <dbl>, sprecdays <dbl>,
#> # spcomp <dbl>, precdays <dbl>, frostdays <dbl>, windays <dbl>,
#> # floodprec <dbl>, floodtemp <dbl>, frosttemp <dbl>, wintemp <dbl>,
#> # signratio1 <dbl>, signratio2 <dbl>, floodratio <dbl>, gaplen <dbl>,
#> # snowtemp <dbl>, gradabs <dbl>, mntmode <dbl>, mntgrad <dbl>,
#> # mntavgdays <dbl>, mntratiodays <dbl>, mntratio <dbl>, niter <dbl>, a <dbl>,
#> # k <dbl>, C <dbl>, aq <dbl>, padding <dbl>, passes <dbl>, filter <chr>
parlist2 = partab |>
dplyr::select(-year) |>
apply(1, as.list) |>
lapply(\(X) {
n = length(X)
X[1:(n - 1)] <- lapply(X[1:(n - 1)], as.numeric)
return(X)
}) |>
setNames(partab$year)
# extract and tweak parameters for selected year
p = parlist[['1989']]
p$grad1 = 1
p$grad2 = 2.5
# use tweaked parameters for all years
sep_debug = gr_separate(spas, params = p, debug = TRUE)
#> grwat: data frame is correct
#> grwat: parameters list and types are OK
#> Warning: grwat: 1974 years were not separated. Check the input data for possible errors. Use gr_get_gaps() and gr_fill_gaps() functions to detect and fill missing data.
#> Warning: grwat: 2002, 2014, 2019 years were processed with jittered parameters
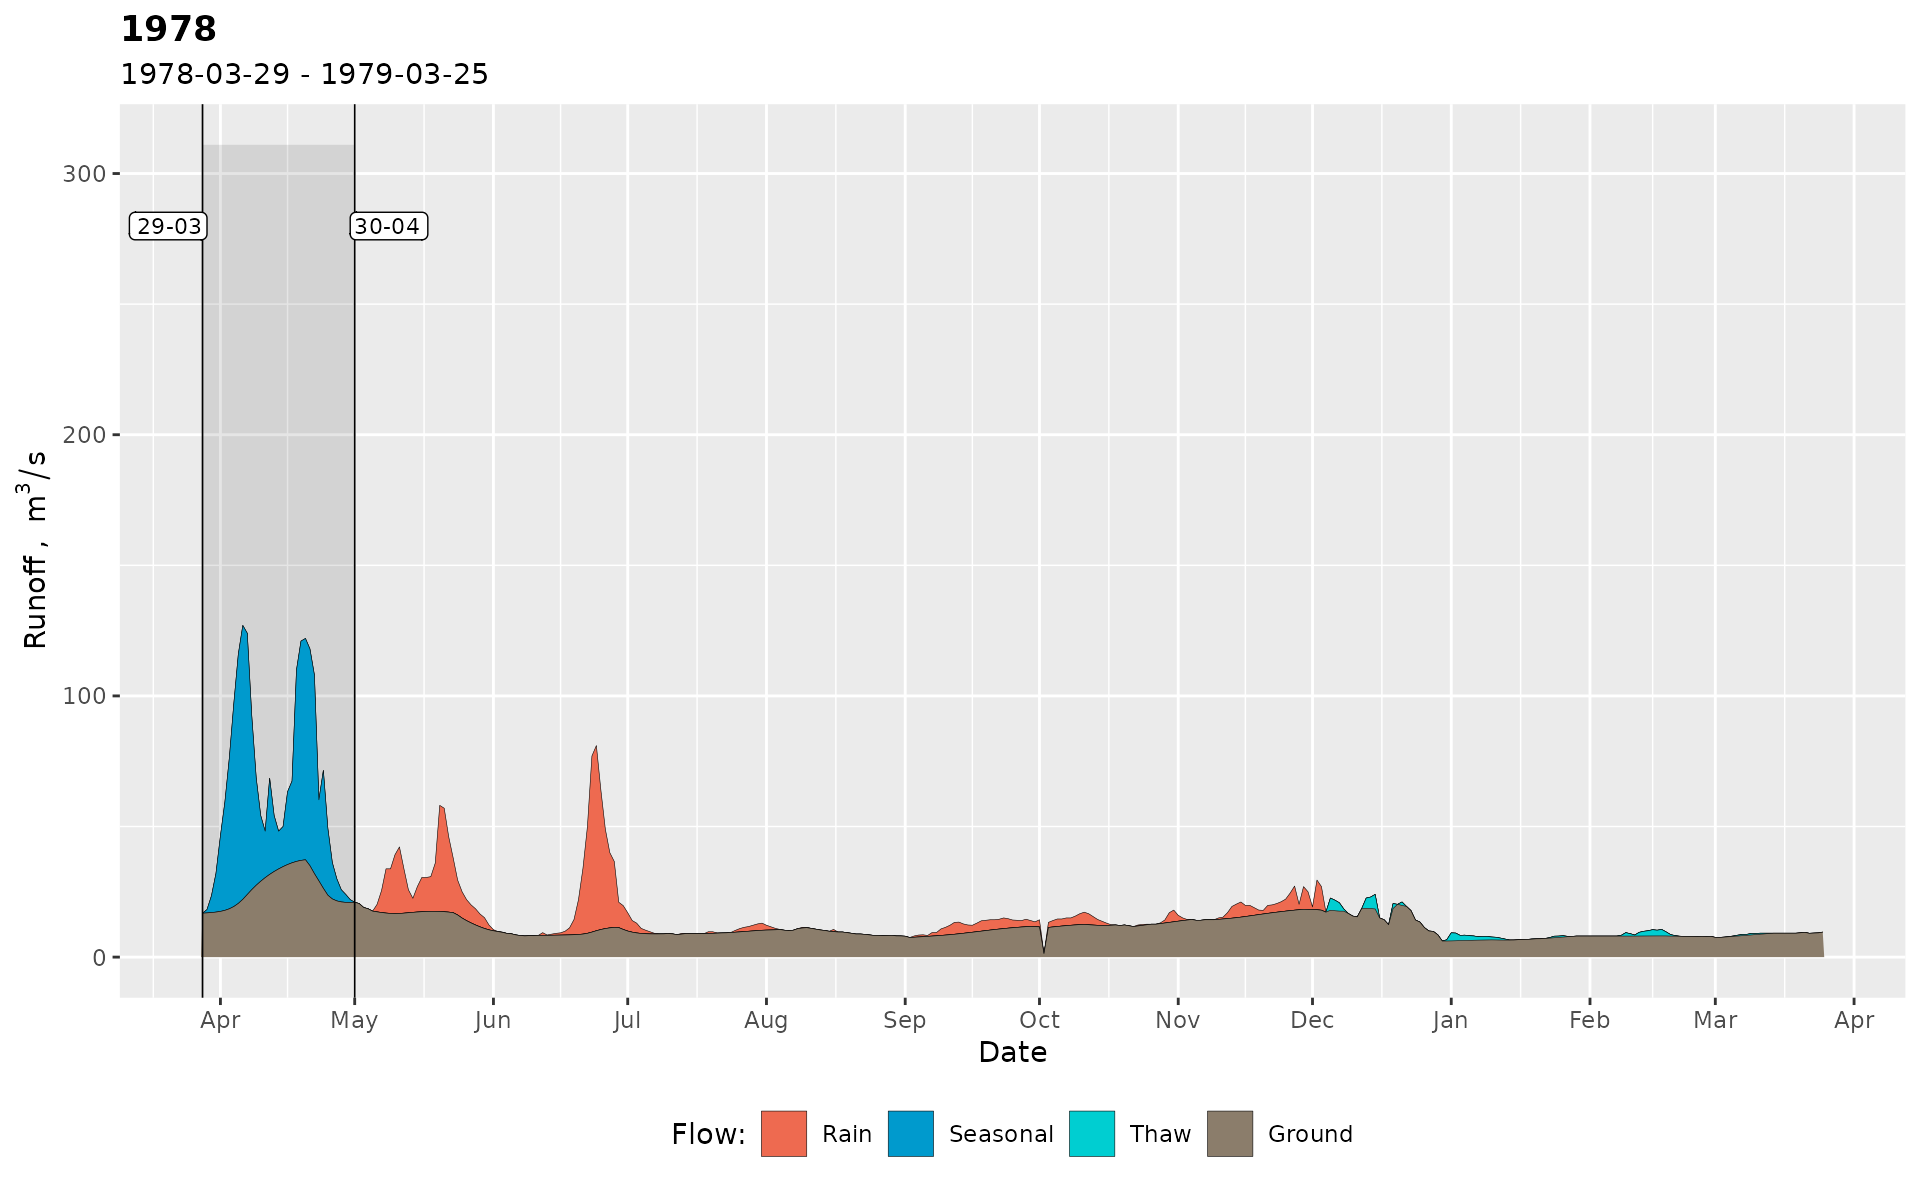
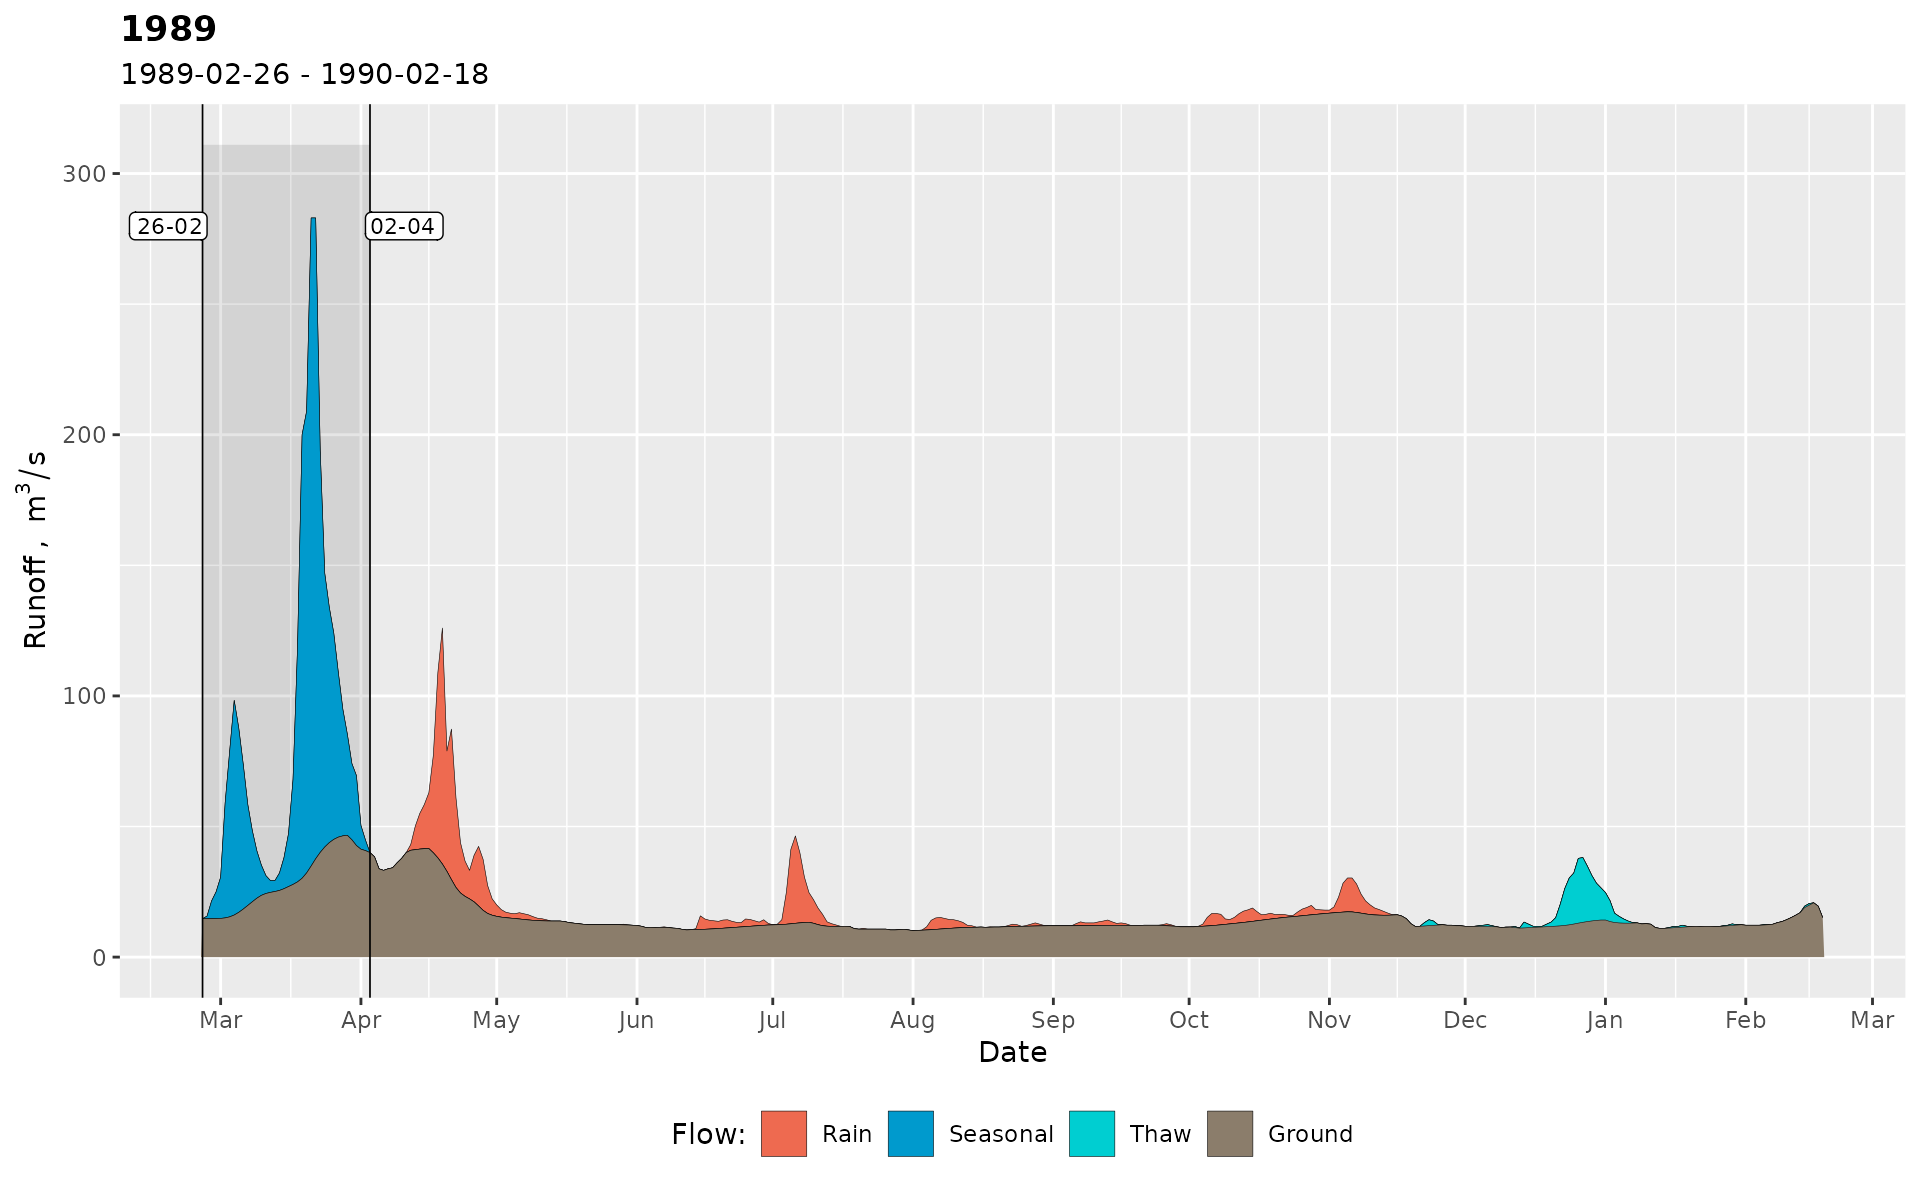
# Visualize
gr_plot_sep(sep_debug, c(1978, 1989))
# Debug mode gives access to additional information
sep_debug = gr_separate(spas,
params = gr_get_params(reg = 'center'),
debug = TRUE)
#> grwat: data frame is correct
#> grwat: parameters list and types are OK
#> Warning: grwat: 1974 years were not separated. Check the input data for possible errors. Use gr_get_gaps() and gr_fill_gaps() functions to detect and fill missing data.
#> Warning: grwat: 2002, 2014, 2019 years were processed with jittered parameters
# a vector of years with jittered params
jit = attributes(sep_debug)$jittered
print(jit)
#> [1] 2002 2014 2019
# actual params used for each year
parlist = attributes(sep_debug)$params
# tabular representation of parameters
partab = gr_to_pardf(parlist)
head(partab)
#> # A tibble: 6 × 40
#> year winmon grad1 grad2 gratio spmon1 spmon2 sprisedays1 sprisedays2 spdays
#> <int> <dbl> <dbl> <dbl> <dbl> <dbl> <dbl> <dbl> <dbl> <dbl>
#> 1 1956 11 1.7 5 400 2 5 8 10 30
#> 2 1957 11 1.7 5 400 2 5 8 10 30
#> 3 1958 11 1.7 5 400 2 5 8 10 30
#> 4 1959 11 1.7 5 400 2 5 8 10 30
#> 5 1960 11 1.7 5 400 2 5 8 10 30
#> 6 1961 11 1.7 5 400 2 5 8 10 30
#> # ℹ 30 more variables: sprise <dbl>, spratio <dbl>, sprecdays <dbl>,
#> # spcomp <dbl>, precdays <dbl>, frostdays <dbl>, windays <dbl>,
#> # floodprec <dbl>, floodtemp <dbl>, frosttemp <dbl>, wintemp <dbl>,
#> # signratio1 <dbl>, signratio2 <dbl>, floodratio <dbl>, gaplen <dbl>,
#> # snowtemp <dbl>, gradabs <dbl>, mntmode <dbl>, mntgrad <dbl>,
#> # mntavgdays <dbl>, mntratiodays <dbl>, mntratio <dbl>, niter <dbl>, a <dbl>,
#> # k <dbl>, C <dbl>, aq <dbl>, padding <dbl>, passes <dbl>, filter <chr>
parlist2 = partab |>
dplyr::select(-year) |>
apply(1, as.list) |>
lapply(\(X) {
n = length(X)
X[1:(n - 1)] <- lapply(X[1:(n - 1)], as.numeric)
return(X)
}) |>
setNames(partab$year)
# extract and tweak parameters for selected year
p = parlist[['1989']]
p$grad1 = 1
p$grad2 = 2.5
# use tweaked parameters for all years
sep_debug = gr_separate(spas, params = p, debug = TRUE)
#> grwat: data frame is correct
#> grwat: parameters list and types are OK
#> Warning: grwat: 1974 years were not separated. Check the input data for possible errors. Use gr_get_gaps() and gr_fill_gaps() functions to detect and fill missing data.
#> Warning: grwat: 2002, 2014, 2019 years were processed with jittered parameters
# Visualize
gr_plot_sep(sep_debug, c(1978, 1989))

 # actual params used for each year
parlist = attributes(sep_debug)$params
# tweak parameters for selected year
parlist[['1989']]$grad1 = 3
parlist[['1989']]$grad2 = 6
# set the sprecdays parameter for multiple years
parlist = gr_set_param(parlist, sprecdays,
years = c(1978, 1989:1995),
value = 15)
# set the spcomp parameter for all years
parlist = gr_set_param(parlist, spcomp, value = 2.5)
# use the list of parameters for separation
sep_debug = gr_separate(spas, params = parlist, debug = TRUE)
#> grwat: data frame is correct
#> grwat: parameters list and types are OK
#> Warning: grwat: 1974 years were not separated. Check the input data for possible errors. Use gr_get_gaps() and gr_fill_gaps() functions to detect and fill missing data.
# Visualize
gr_plot_sep(sep_debug, c(1978, 1989))
# actual params used for each year
parlist = attributes(sep_debug)$params
# tweak parameters for selected year
parlist[['1989']]$grad1 = 3
parlist[['1989']]$grad2 = 6
# set the sprecdays parameter for multiple years
parlist = gr_set_param(parlist, sprecdays,
years = c(1978, 1989:1995),
value = 15)
# set the spcomp parameter for all years
parlist = gr_set_param(parlist, spcomp, value = 2.5)
# use the list of parameters for separation
sep_debug = gr_separate(spas, params = parlist, debug = TRUE)
#> grwat: data frame is correct
#> grwat: parameters list and types are OK
#> Warning: grwat: 1974 years were not separated. Check the input data for possible errors. Use gr_get_gaps() and gr_fill_gaps() functions to detect and fill missing data.
# Visualize
gr_plot_sep(sep_debug, c(1978, 1989))