This function generates boxplots of the hydrograph separation variables produced by gr_summarize(). The data for each variable is divided into two samples: before and after the change year either set by year parameter or extracted from tests (statistically estimated). Different background fill colors are used to differentiate seasons types.
Usage
gr_plot_periods(
  df,
  ...,
  year = NULL,
  exclude = NULL,
  tests = NULL,
  layout = as.matrix(1),
  pagebreak = FALSE,
  print = TRUE
)
Arguments
- df
data.frameof hydrograph and meteorological variables produced bygr_summarize().- ...
Quoted sequence of variable names.
- year
Integer. Change year value to separate two periods (overridden by tests if it is supplied).
- exclude
Integer vector of years to be excluded from plotting.
- tests
Tests list for the same variables (generated by
gr_test_vars()function)- layout
matrixthat encodes the order of plotting.- pagebreak
Logical. Whether to break page between plots (needed for reporting). Defaults to
FALSE.Boolean. Print plot? Defaults to
TRUE. UseFALSEif you want to tweak the plot aesthetics before plotting.
Examples
library(grwat)
data(spas) # example Spas-Zagorye data is included with grwat package
# separate
sep = gr_separate(spas, params = gr_get_params(reg = 'center'))
#> grwat: data frame is correct
#> grwat: parameters list and types are OK
# summarize from 1965 to 1990
vars = gr_summarize(sep, 1965, 1990)
#> Warning: There were 4 warnings in `dplyr::summarise()`.
#> The first warning was:
#> ℹ In argument: `Dspstart = min(.data$Date[which(.data$Qspri > 0)])`.
#> ℹ In group 10: `Year1 = 1974`.
#> Caused by warning in `min.default()`:
#> ! no non-missing arguments to min; returning Inf
#> ℹ Run `dplyr::last_dplyr_warnings()` to see the 3 remaining warnings.
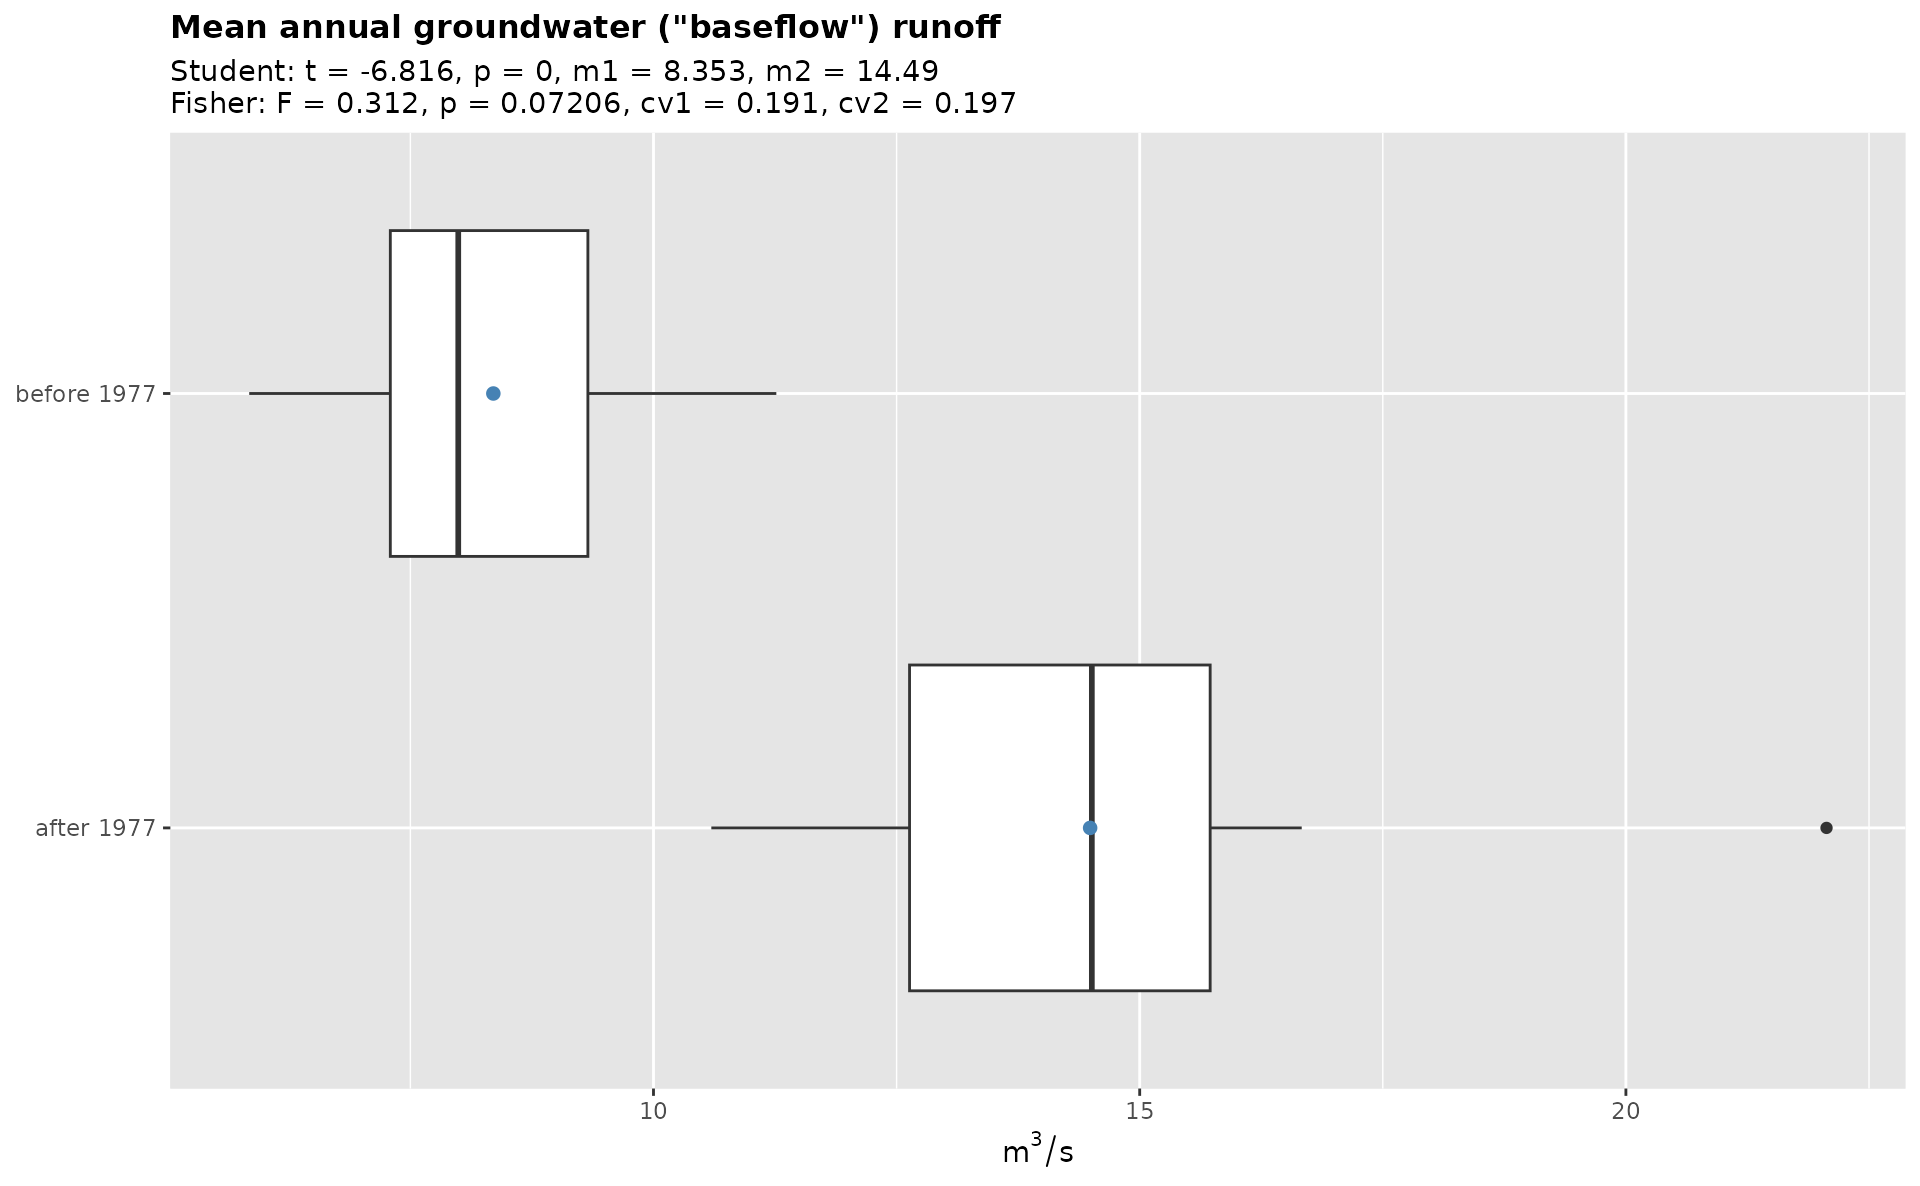
# plot periods with fixed change year
gr_plot_periods(vars, Qygr, year = 1978)
#> Warning: Removed 1 row containing non-finite outside the scale range (`stat_boxplot()`).
 # plot periods with change year from Pettitt test
gr_plot_periods(vars, Qygr, tests = TRUE)
#> Warning: Removed 1 row containing non-finite outside the scale range (`stat_boxplot()`).
# plot periods with change year from Pettitt test
gr_plot_periods(vars, Qygr, tests = TRUE)
#> Warning: Removed 1 row containing non-finite outside the scale range (`stat_boxplot()`).
 # calculate test beforehand
tests = gr_test_vars(vars)
gr_plot_periods(vars, Qspmax, tests = tests)
#> Warning: Removed 1 row containing non-finite outside the scale range (`stat_boxplot()`).
# calculate test beforehand
tests = gr_test_vars(vars)
gr_plot_periods(vars, Qspmax, tests = tests)
#> Warning: Removed 1 row containing non-finite outside the scale range (`stat_boxplot()`).
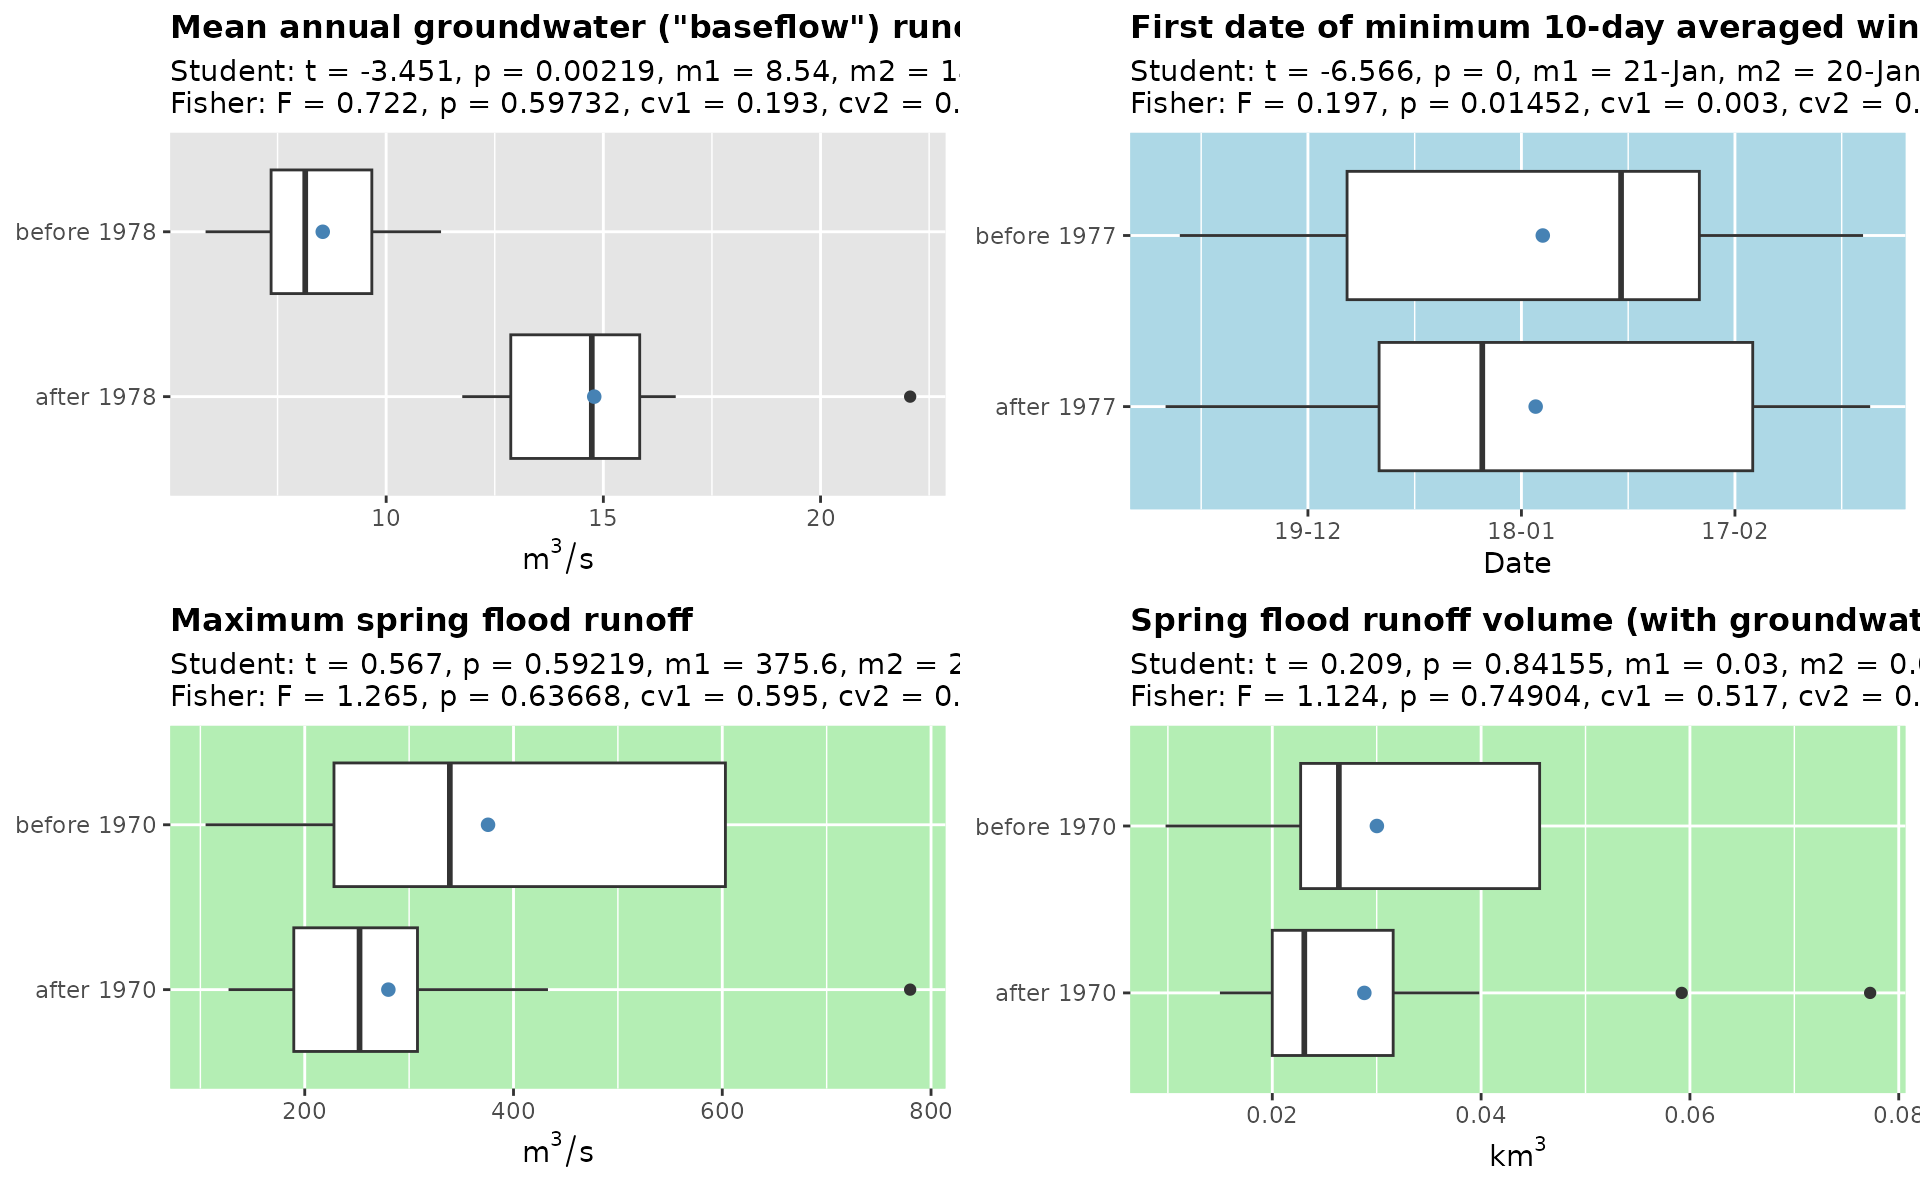
 # use matrix layout to plot multiple variables
gr_plot_periods(vars, Qygr, Qspmax, D10w1, Wsprngr,
layout = matrix(1:4, nrow = 2),
tests = tests)
#> Warning: Removed 1 row containing non-finite outside the scale range (`stat_boxplot()`).
#> Warning: Removed 1 row containing non-finite outside the scale range (`stat_boxplot()`).
#> Warning: Removed 1 row containing non-finite outside the scale range (`stat_boxplot()`).
#> Warning: Removed 1 row containing non-finite outside the scale range (`stat_boxplot()`).
# use matrix layout to plot multiple variables
gr_plot_periods(vars, Qygr, Qspmax, D10w1, Wsprngr,
layout = matrix(1:4, nrow = 2),
tests = tests)
#> Warning: Removed 1 row containing non-finite outside the scale range (`stat_boxplot()`).
#> Warning: Removed 1 row containing non-finite outside the scale range (`stat_boxplot()`).
#> Warning: Removed 1 row containing non-finite outside the scale range (`stat_boxplot()`).
#> Warning: Removed 1 row containing non-finite outside the scale range (`stat_boxplot()`).