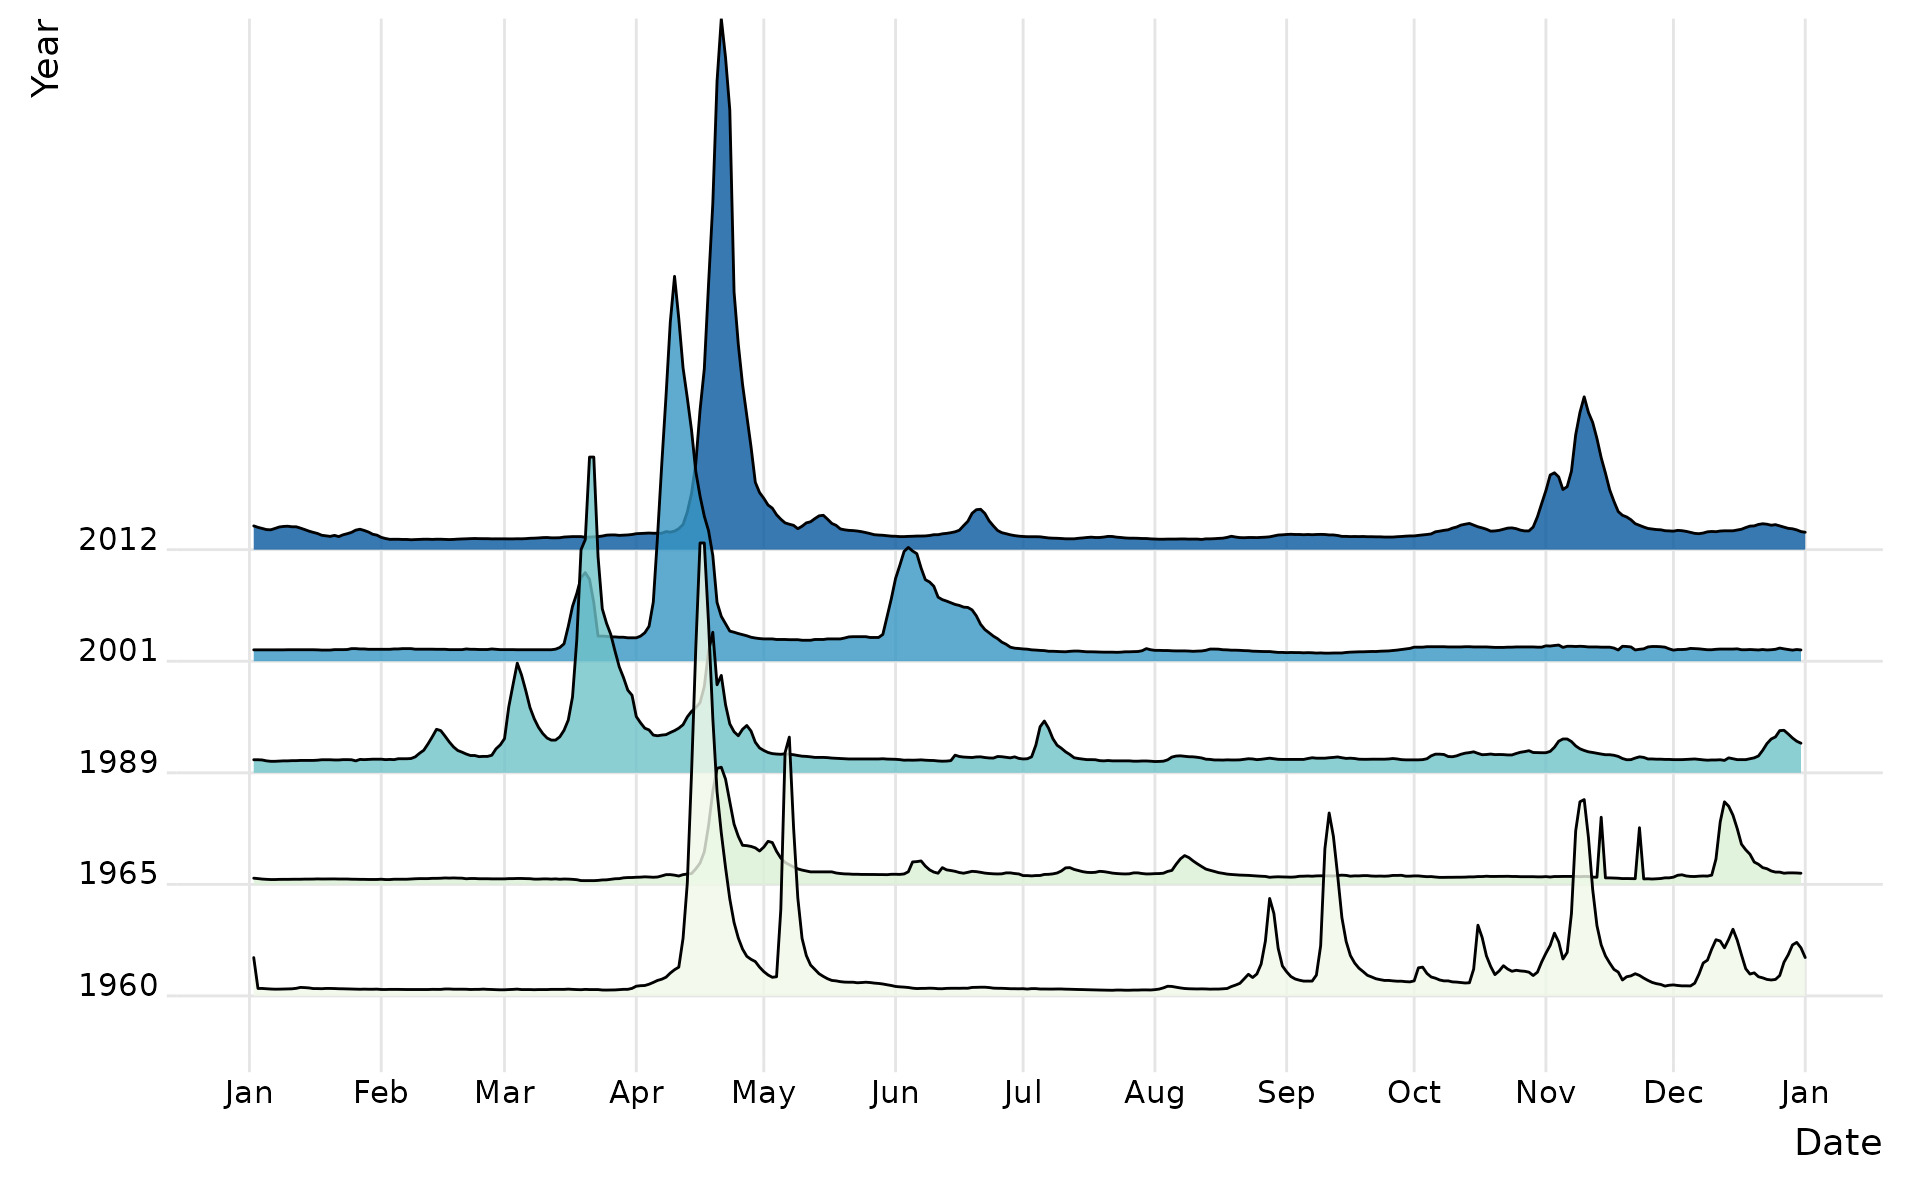
A convenient wrapper around ggridges::geom_ridgeline() to visualize multiple river hydrographs at once.
Arguments
- df
data.framewith date (1st) and runoff (2nd) columns.- years
Integer vector of years to be plotted.
- pal
Numeric or character string. Color palette identifier passed to
ggplot2::scale_fill_distiller().- rev
Boolean. Reverse the palette? Defaults to
FALSE.- scale
Numeric scale factor passed to
ggridges::geom_ridgeline(). Defaults to0.01.- alpha
Numeric opacity value of the ridgeline plot. Defaults to
0.8.Boolean. Print plot? Defaults to
TRUE. UseFALSEif you want to tweak the plot aesthetics before plotting.
Value
ggplot2 object representing the multiple river hydrographs at once using the ridgeline plot approach
Examples
if (require("ggridges")) {

  library(grwat)

  data(spas) # example Spas-Zagorye data is included with grwat package

  # separate
  sep = gr_separate(spas, params = gr_get_params(reg = 'center'))

  # ridgline plot for selected years
  gr_plot_ridge(sep, years = c(1960, 1965, 1989, 2001, 2012))

}
#> Loading required package: ggridges
#> grwat: data frame is correct
#> grwat: parameters list and types are OK