The function plots river hydrograph by filling the different flow types using colors. Matrix layouts can be used if multiple plots are needed. Temperature and precipitation can be overlaid.
Usage
gr_plot_sep(
  df,
  years = NULL,
  layout = as.matrix(1),
  pagebreak = FALSE,
  temp = FALSE,
  prec = FALSE,
  span = 5,
  print = TRUE,
  yrange = "uniform"
)
Arguments
- df
data.frameof hydrograph separation as produced bygr_separate().- years
Integer vector of years to be plotted.
- layout
matrixthat encodes the order of plotting.- pagebreak
Logical. Whether to break page between plots (used by
gr_report()). Defaults toFALSE.- temp
Boolean. Add temperature curve to the plot? Defaults to
FALSE. If bothtemp = TRUEandprec = TRUE, then the axis is drawn for precipitation.- prec
Boolean. Add precipitation curve to the plot? Defaults to
FALSE. If bothtemp = TRUEandprec = TRUE, then the axis is drawn for precipitation.- span
Integer number of days to accumulate precipitation for plotting.
Boolean. Print plot? Defaults to
TRUE. UseFALSEif you want to tweak the plot aesthetics before plotting.- yrange
Boolean. Y range for each plot. Defaults to
'uniform'which means that the highest value of Y axis is the same on all plots and is determined by the highest discharge for all years to be plotted. Use'each'if you want each plot to have its own maximum along Y axis determined by the highest discharge for this year. You can also use any numeric valueymaxin a formyrange = ymaxto determine your own Y scale maximum for all plots.
Examples
library(grwat)
data(spas) # example Spas-Zagorye data is included with grwat package
# separate
sep = gr_separate(spas, params = gr_get_params(reg = 'center'))
#> grwat: data frame is correct
#> grwat: parameters list and types are OK
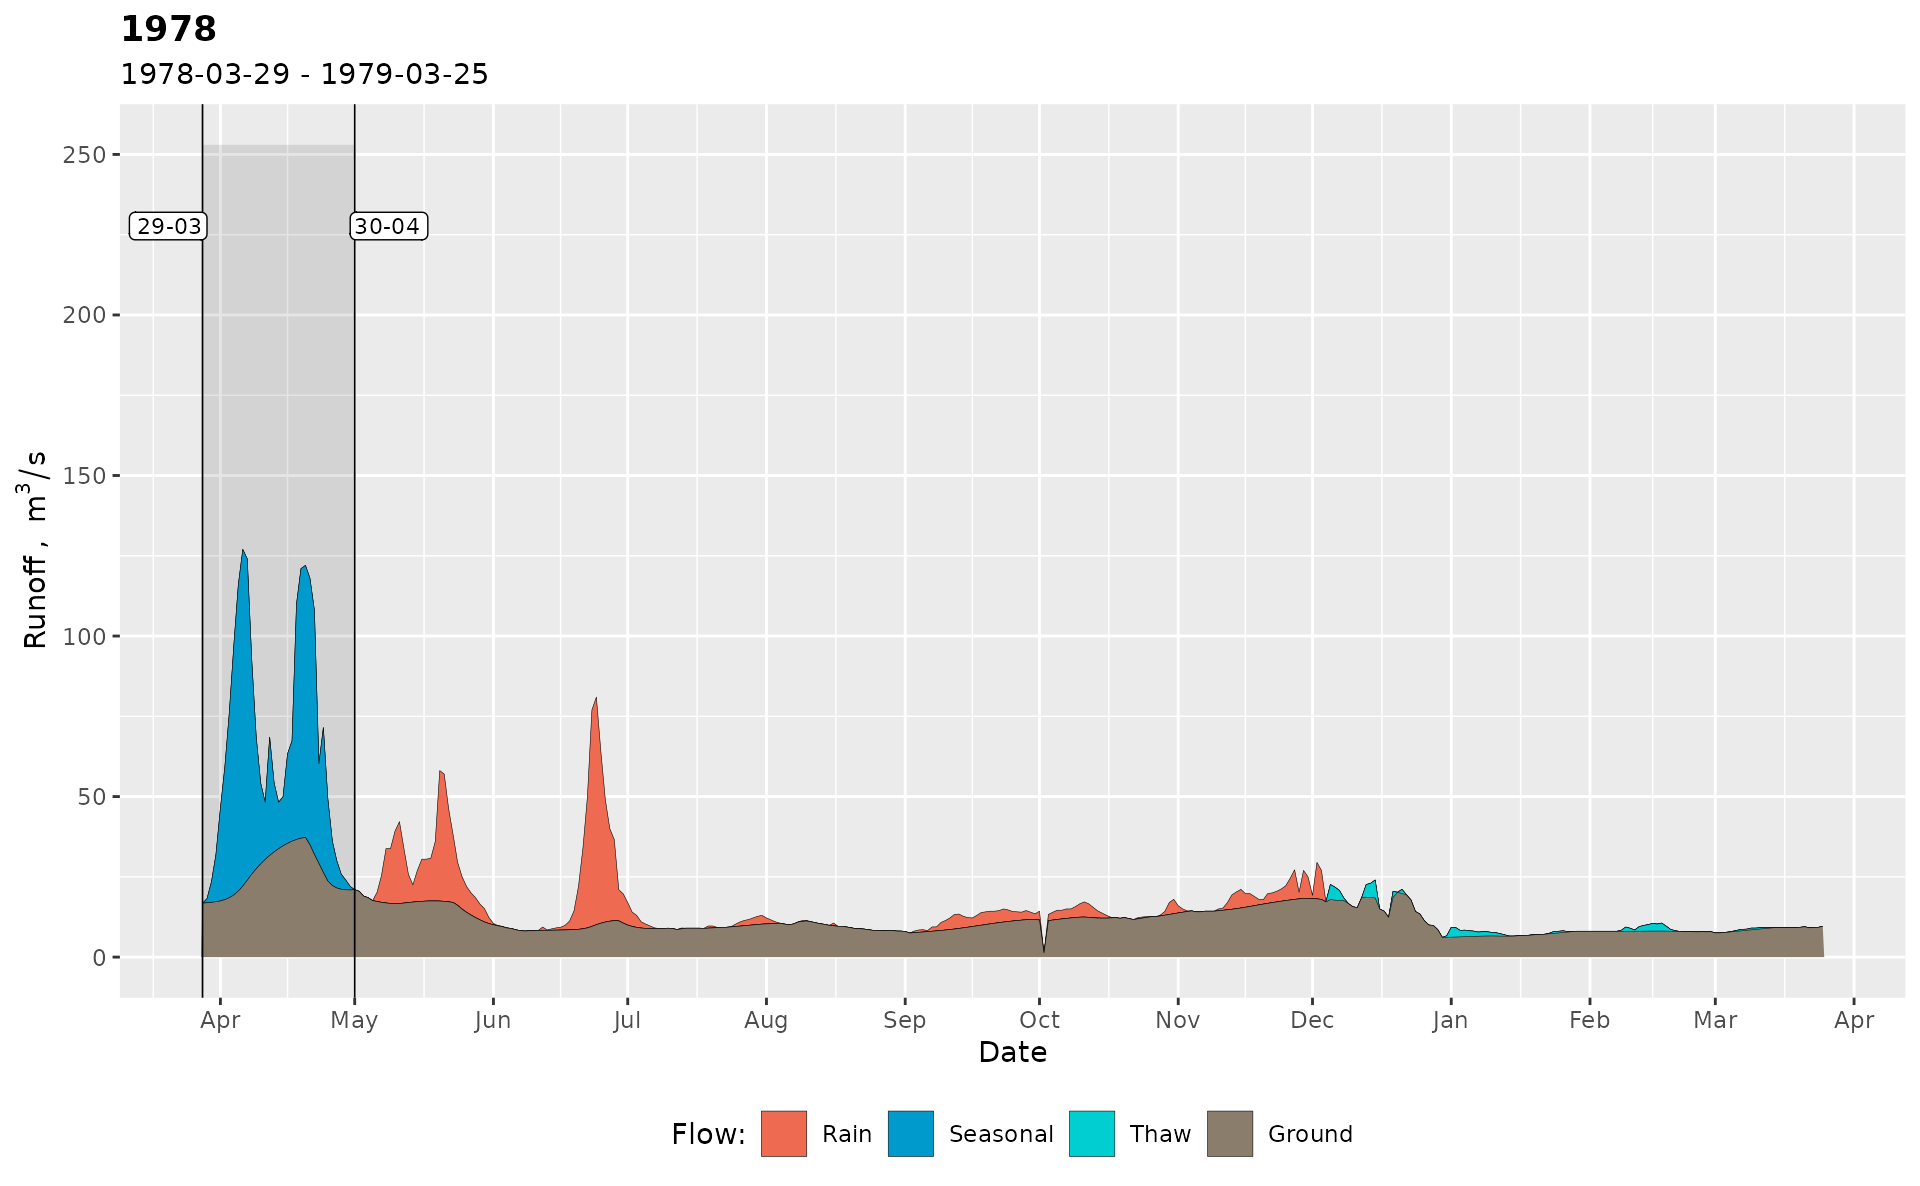
# One year
gr_plot_sep(sep, 1978)
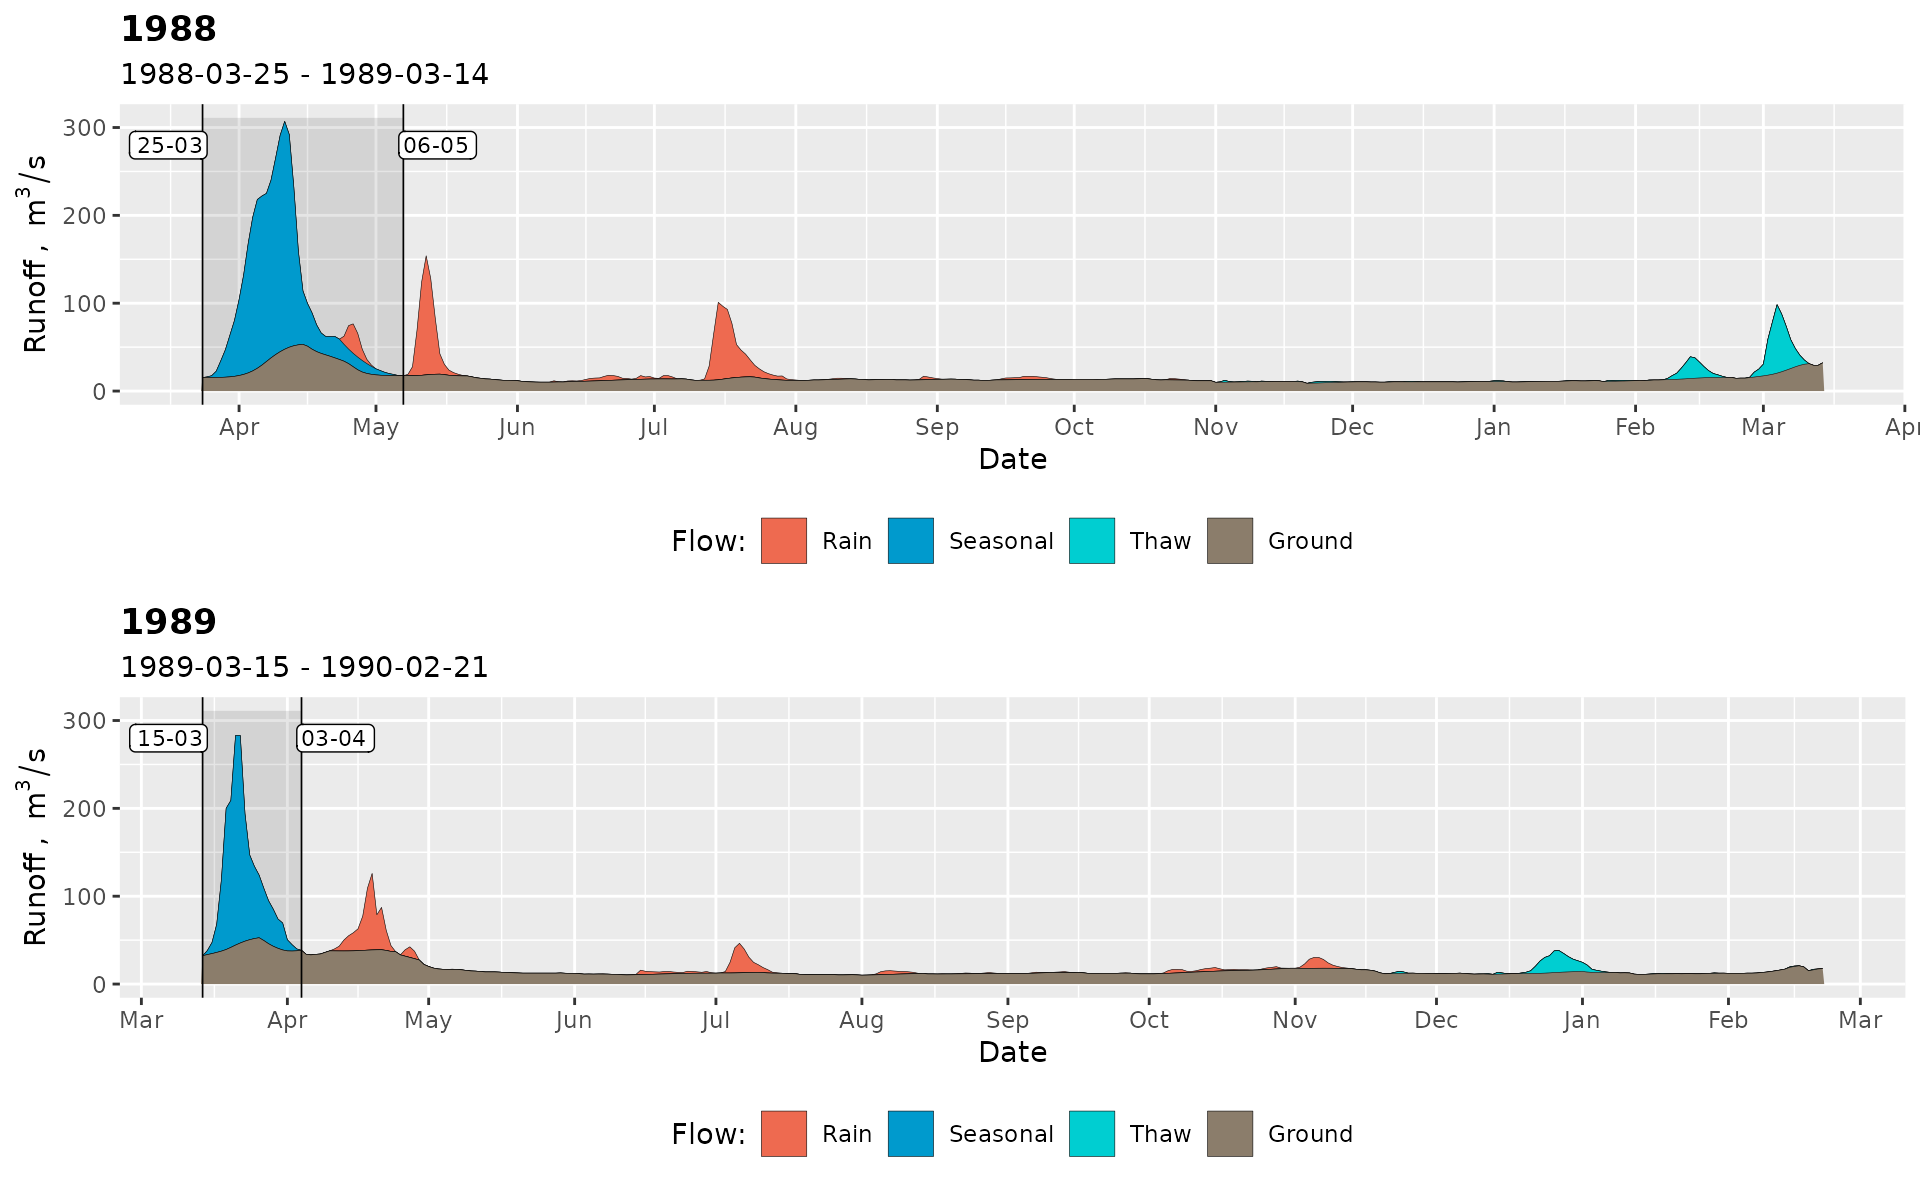
 # Two years
gr_plot_sep(sep, c(1978, 1989))
# Two years
gr_plot_sep(sep, c(1978, 1989))

 # Two years in a matrix layout
gr_plot_sep(sep, 1987:1988, layout = matrix(1:2, nrow = 2, byrow = TRUE))
# Two years in a matrix layout
gr_plot_sep(sep, 1987:1988, layout = matrix(1:2, nrow = 2, byrow = TRUE))
 # Four years in a matrix layout with free Y scale
gr_plot_sep(sep, 1987:1990, layout = matrix(1:4, nrow = 2, byrow = TRUE), yrange = 'each')
# Four years in a matrix layout with free Y scale
gr_plot_sep(sep, 1987:1990, layout = matrix(1:4, nrow = 2, byrow = TRUE), yrange = 'each')
 #> Plotting separation ■■■■■■■■■■■■■■■■■■■■■■■■■ 80% | ETA: 1s
#> Plotting separation ■■■■■■■■■■■■■■■■■■■■■■■■■■■■■■■ 100% | ETA: 0s
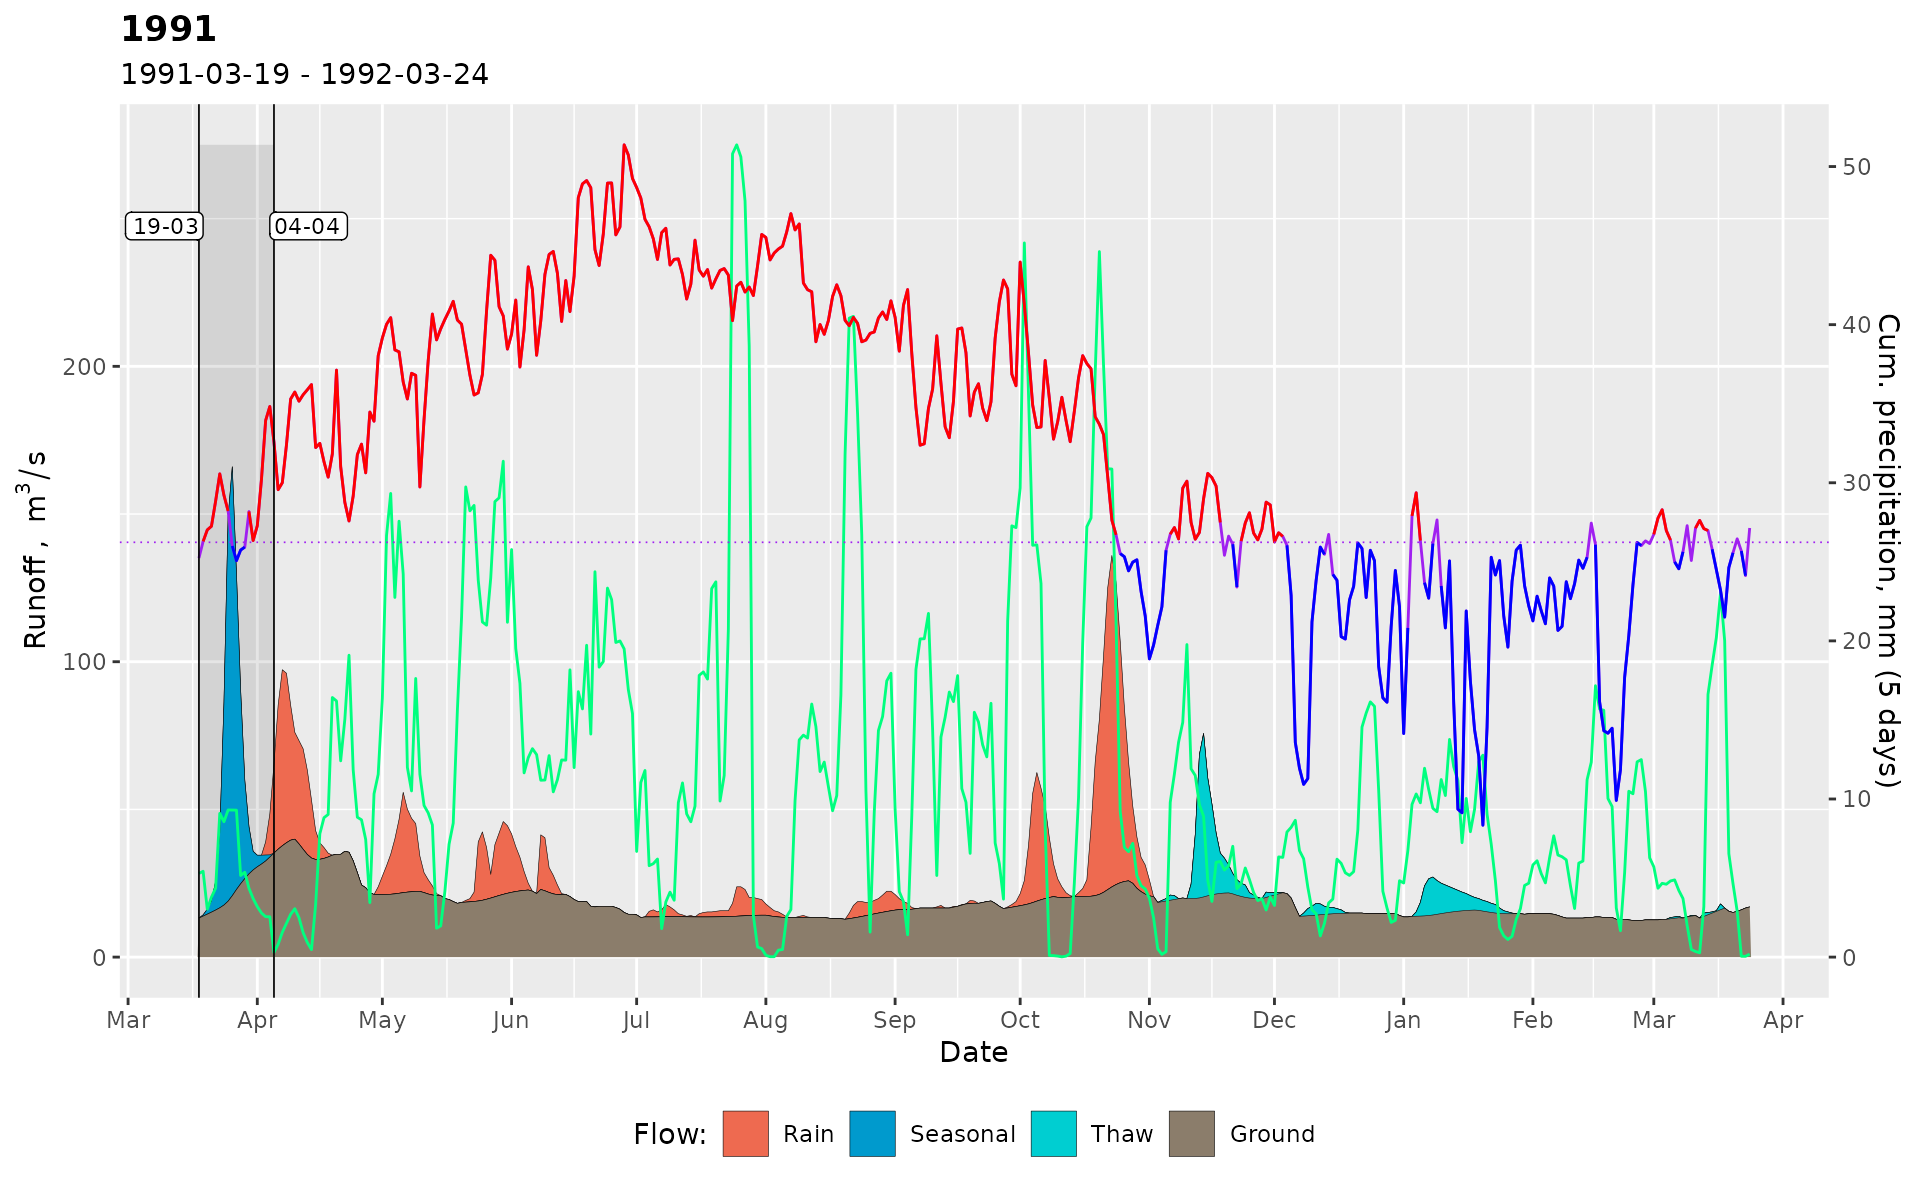
# Add temperature and precipitation
gr_plot_sep(sep, 1991, temp = TRUE, prec = TRUE)
#> Plotting separation ■■■■■■■■■■■■■■■■■■■■■■■■■ 80% | ETA: 1s
#> Plotting separation ■■■■■■■■■■■■■■■■■■■■■■■■■■■■■■■ 100% | ETA: 0s
# Add temperature and precipitation
gr_plot_sep(sep, 1991, temp = TRUE, prec = TRUE)
