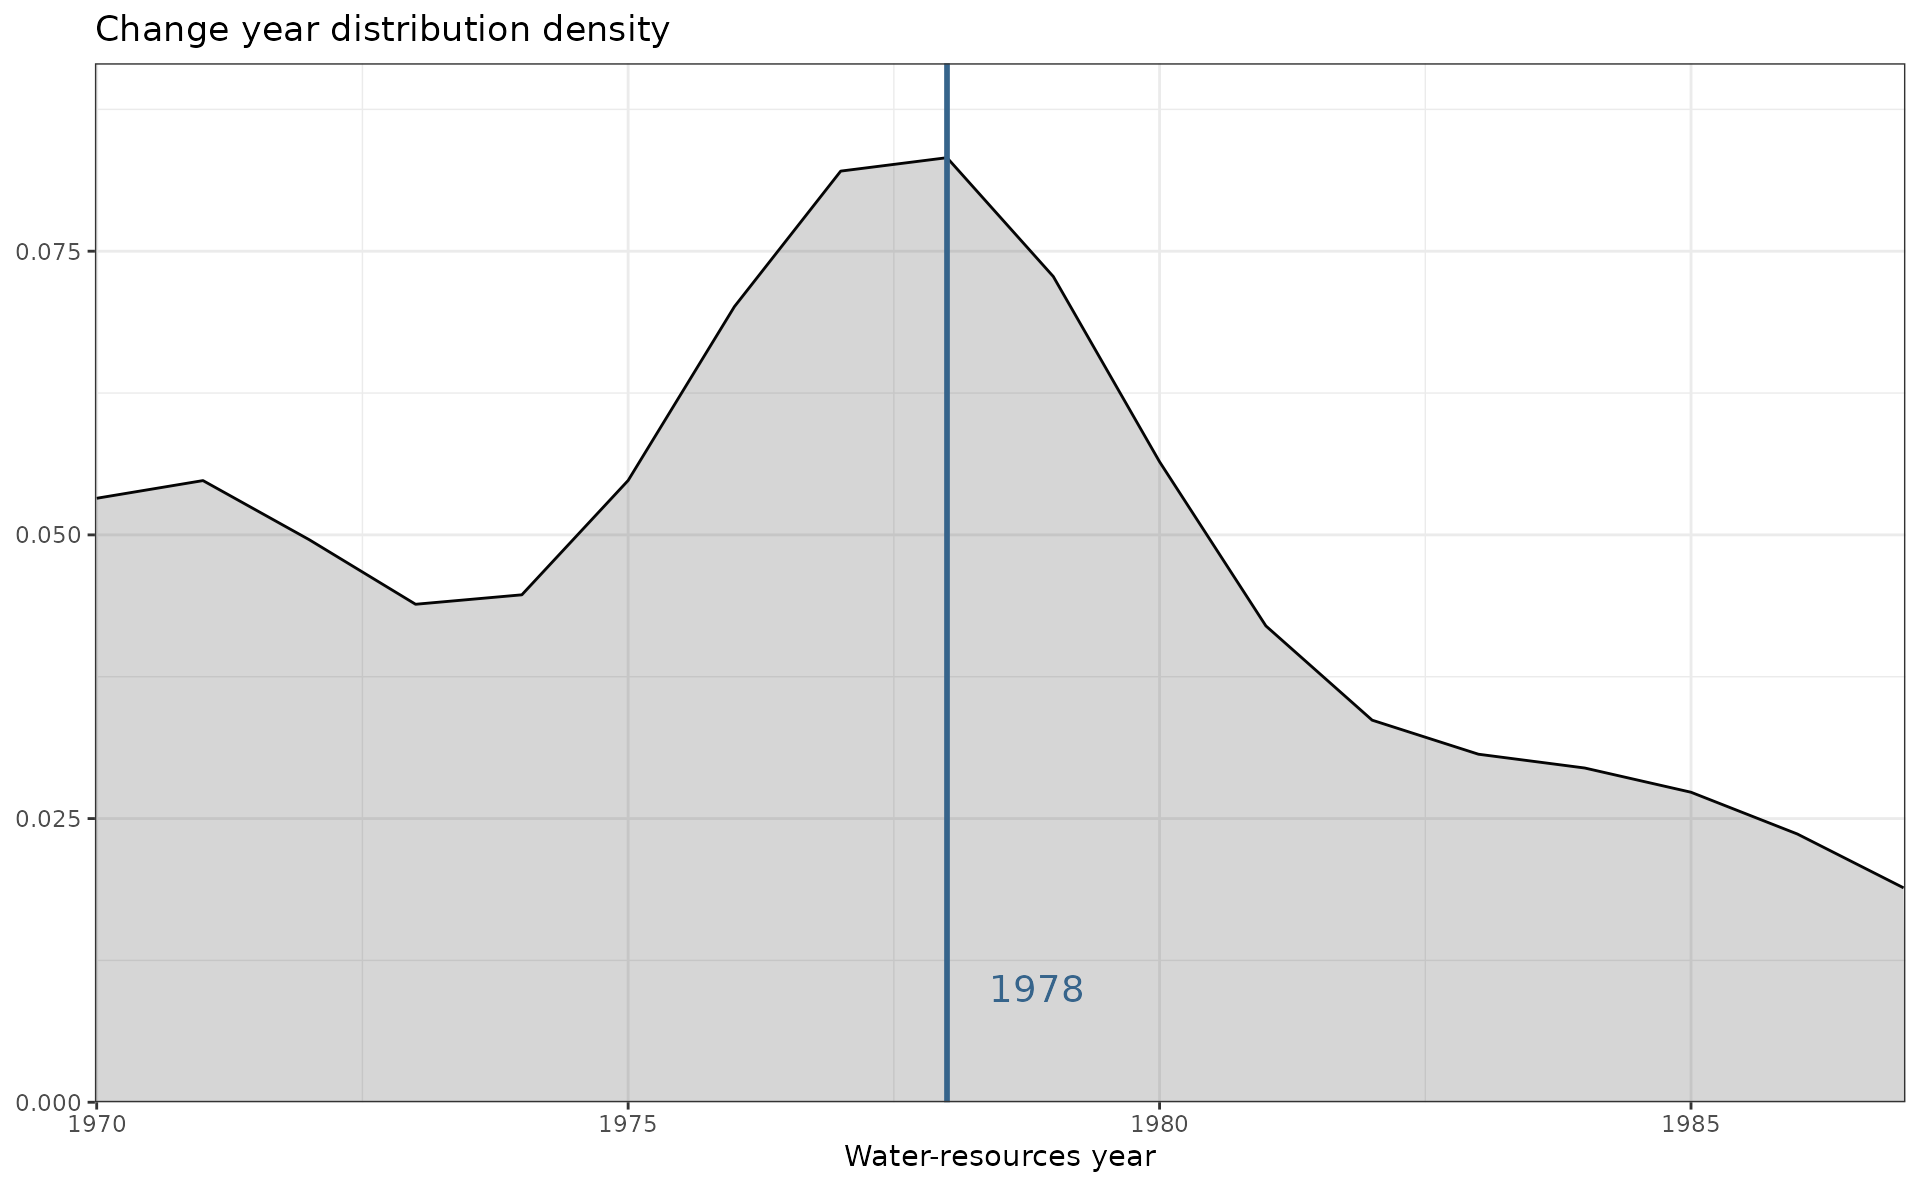
The function extracts change years from results of gr_test_vars() and plots their probability density. Since for every variable the change year is individual, this procedure allows finding the one most probable year, which is the mode of the distribution. This year is highlighted by the line and labeled on the plot.
Arguments
- tests
listof tests generated bygr_test_vars().- type
Character string type of the plot. Currently only
'year'is supported, which means that the distribution density of the change year detected by Pettitt test is visualized. Ignored until other types are implemented.Boolean. Print plot? Defaults to
TRUE. UseFALSEif you want to tweak the plot aesthetics before plotting.
Examples
library(grwat)

data(spas) # example Spas-Zagorye data is included with grwat package

# separate
sep = gr_separate(spas, params = gr_get_params(reg = 'center'))
#> grwat: data frame is correct
#> grwat: parameters list and types are OK

# summarize from 1965 to 1990
vars = gr_summarize(sep, 1965, 1990)
#> Warning: There were 4 warnings in `dplyr::summarise()`.
#> The first warning was:
#> ℹ In argument: `Dspstart = min(.data$Date[which(.data$Qspri > 0)])`.
#> ℹ In group 10: `Year1 = 1974`.
#> Caused by warning in `min.default()`:
#> ! no non-missing arguments to min; returning Inf
#> ℹ Run `dplyr::last_dplyr_warnings()` to see the 3 remaining warnings.

# test all variables
tests = gr_test_vars(vars)

# plot change year from Pettitt test
gr_plot_tests(tests, type = 'year')
